


The Jordan, Knauff & Company (JKC) Valve Stock Index was up 18.5 percent during the last 12 months, staying close to the broader S&P 500 Index, which was up 21.3 percent. The JKC Pump Stock Index was up 34.9 percent for the same time period.1
The Institute for Supply Management’s Purchasing Managers’ Index (PMI) was 55.3 percent in June, a slight decrease of 0.1 percent from May. The New Orders Index increased 2 percent to 58.9 percent, and the Production Index fell 1 percent to 60 percent.
The U.S. Commerce Department reported that the gross domestic product (GDP) declined by 2.9 percent during the first quarter of 2014. This is a much larger decline than previously estimated in May. Significant declines in nonfarm inventory investment and net exports, as well as nonfederal government spending, business investment and housing investment, contributed to the GDP decline. In the fourth quarter of 2013, GDP grew by 2.6 percent.
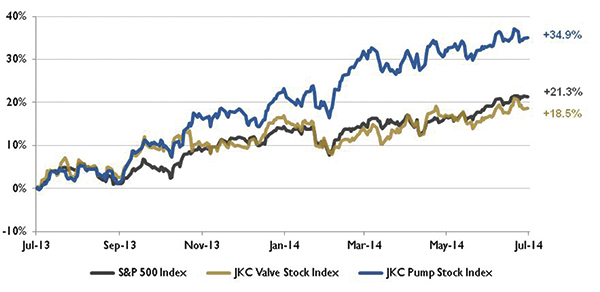 Figure 1. Stock indices from July 1, 2013, to June 30, 2014. Source: Capital IQ and JKC research. Local currency converted to USD using historical spot rates. The JKC Pump and Valve Stock Indices include a select list of publicly-traded companies involved in the pump and valve industries weighted by market capitalization.
The U.S. Bureau of Labor reported that total nonfarm payroll employment increased by 288,000 in June, and the unemployment rate decreased to 6.1 percent. Led by growth in professional and business services, retail trade, food and beverage, and health care, the job gains were widespread. The manufacturing sector added 16,000 jobs in June with all of the increase occurring in the durable goods area. Employment gains in April and May were 29,000 higher than previously reported. During the past three months, job growth has averaged 272,000 per month.
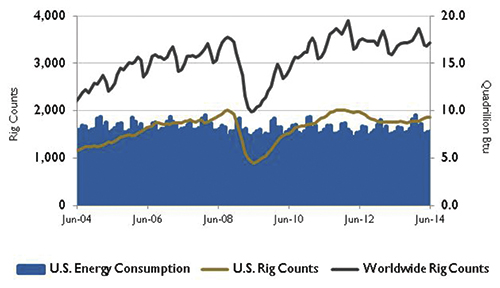 Figure 2. U.S. energy consumption and rig counts. Source: U.S. Energy Information Administration and Baker Hughes Inc.
U.S. crude oil production was an estimated 7.4 million barrels per day (bpd) in 2013, according to the U.S. Energy Information Administration, and is forecast to grow to 8.4 million bpd this year and 9.3 million bpd in 2015. Previously, the highest annual average production was 9.6 million bpd in 1970.
Combined crude oil production from Texas and North Dakota reached 4 million barrels per day in April and now accounts for 48 percent of the country’s oil production. In April 2010, these two states produced only 26 percent of U.S. production. During the past three years, Texas has more than doubled its production, while North Dakota has nearly tripled its production. During the past four years, the Gulf of Mexico’s production share has declined from 27 percent to 17 percent.
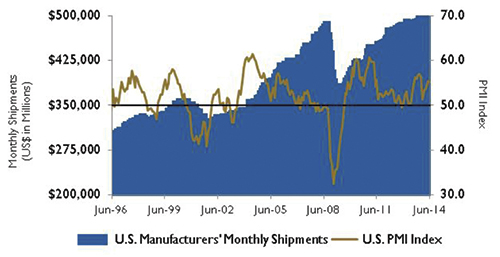 Figure 3. U.S. PMI index and manufacturing shipments. Source: Institute for Supply Management Manufacturing Report on Business and U.S. Census Bureau
On Wall Street, the Dow Jones Industrial Average gained 0.7 percent for the month of June, while the S&P 500 Index gained 1.9 percent and the NASDAQ Composite rose 3.9 percent. Technology, media, financial and small-cap stocks all increased during the month. Investors were encouraged by the European Central Bank’s stimulus measures to aid the Eurozone’s recovery and positive economic data in the U.S. For the first half of 2014, the Dow, S&P 500 and NASDAQ were all up with gains of 1.5 percent, 6.1 percent and 5.5 percent, respectively, with airline, pharmaceutical and utilities stocks gaining the most.
Reference
1. The S&P Return figures are provided by Capital IQ.