


The Jordan, Knauff & Company (JKC) Valve Stock Index was down 5.6 percent during the last 12 months, while the broader S&P 500 Index was up 14.8 percent. The JKC Pump Stock Index decreased 8 percent for the same time period.1
The Institute for Supply Management’s Purchasing Managers’ Index (PMI) decreased 0.3 percent from October’s reading to 58.7 percent. The New Orders and Production indices were stable at 66 and 64.4 percent, respectively. The Exports index rose from 51.5 percent in October to 55 percent in November, showing that demand from overseas is still present despite worries about a global economic slowdown. The Price index fell 9 percent in November to 44.5 percent, indicating much lower raw materials prices for manufacturers and lower inflation pressures in the economy because of the recent decrease in oil prices.
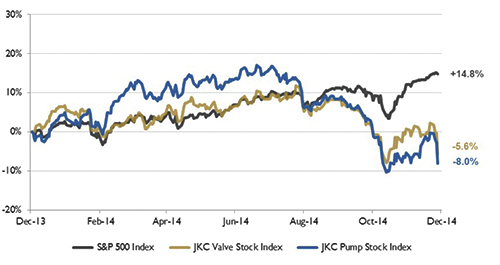 Figure 1. Stock indices from December 1, 2013, to November 30, 2014. Source: Capital IQ and JKC research. Local currency converted to USD using historical spot rates. The JKC Pump and Valve Stock Indices include a select list of publicly traded companies involved in the pump and valve industries weighted by market capitalization.
The Bureau of Labor Statistics reported that nonfarm payroll employment increased by 321,000 in November. During the previous 12 months, monthly job gains averaged 224,000. These gains were widespread, led by professional and business services (more than 86,000); retail trade (more than 50,000); and health care (more than 29,000). The manufacturing sector added 28,000 jobs, with durable goods manufacturers accounting for most of the increase. In the retail sector, gains were made by both motor vehicle and parts dealers and clothing and accessories stores. Construction employment continued to trend up, adding 20,000 jobs.
At the end of November, the Organization of Petroleum Exporting Countries (OPEC) decided not to reduce oil production and to keep their production volume at 30 million barrels per day, which caused global oil prices to sharply decline. The price of West Texas Intermediate crude oil fell 11.4 percent after the announcement to $66.15 per barrel, its lowest level since September 2009. Brent crude oil prices fell 10.8 percent to $70.15 per barrel, its lowest level since May 2010.
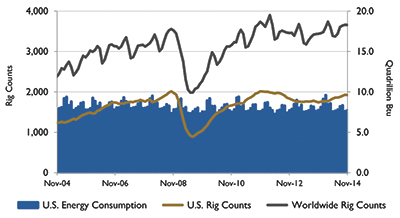 Figure 2. U.S. energy consumption and rig counts. Source: U.S. Energy Information Administration and Baker Hughes Inc.
The U.S. Energy Information Administration (EIA) reported that U.S. crude oil and lease condensate proved reserves exceeded 36 billion barrels for the first time since 1975. In 2013, the reserves rose for the fifth consecutive year, increasing by 9 percent over the 2012 level, reaching 36.5 billion barrels. Additional drilling and exploration of reservoirs previously discovered accounted for the majority of proved reserves increases over the past three years. North Dakota had the largest increase in oil reserves in 2013 and has more reserves than the federal offshore waters of the Gulf of Mexico. Texas remains the leader in total proved oil reserves, increasing 8 percent in 2013 to 12 billion barrels.
The Dow Jones Industrial Average and the S&P 500 Index both gained 2.5 percent in November. The NASDAQ Composite rose 3.5 percent. Encouraging earnings results from retailers and easing global growth concerns lifted the markets. The European Central Bank began purchasing asset-backed securities and the People’s Bank of China lowered its key interest rate. The decline in oil prices had a negative impact on energy stocks.
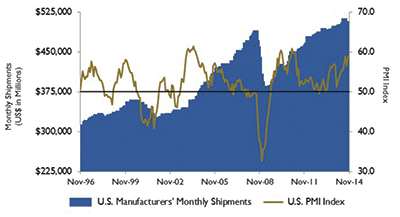 Figure 3. U.S. PMI and manufacturing shipments. Source: Institute for Supply Management Manufacturing Report on Business and U.S. Census Bureau
Reference
1. The S&P Return figures are provided by Capital IQ.
Jordan, Knauff & Company is an investment bank based in Chicago, Illinois, that provides merger and acquisition advisory services to the pump, valve and filtration industries. Please visit jordanknauff.com for further information. Jordan Knauff & Company is a member of FINRA.
These materials were prepared for informational purposes from sources that are believed to be reliable but which could change without notice. Jordan, Knauff & Company and Pumps & Systems shall not in any way be liable for claims relating to these materials and makes no warranties, express or implied, or representations as to their accuracy or completeness or for errors or omissions contained herein. This information is not intended to be construed as tax, legal or investment advice. These materials do not constitute an offer to buy or sell any financial security or participate in any investment offering or deployment of capital.