


The Jordan, Knauff & Company (JKC) Valve Stock Index was down 16.3 percent during the last 12 months, while the broader S&P 500 Index was up 10.7 percent. The JKC Pump Stock Index also decreased 15.4 percent for the same time period.1
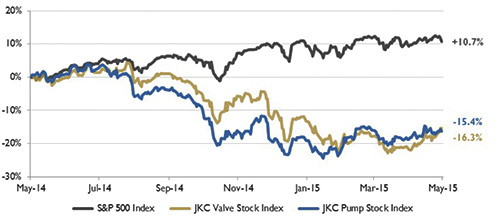 Figure 1. Stock indices from May 1, 2014, to April 30, 2015 (Source: Capital IQ and JKC research. Local currency converted to USD using historical spot rates. The JKC Pump and Valve Stock Indices include a select list of publicly traded companies involved in the pump and valve industries weighted by market capitalization.)
 The Institute for Supply Management's Purchasing Managers' Index (PMI) was unchanged and remained at 51.5 percent for the month of April. The average reading for the last 12 months is 55.2 percent. Positive areas in the report included a 2.2 percent rise in production (to a three-month high), a 1.7 percent increase in new orders and a 4.0 percent increase in exports. Another positive area of the report indicates that 15 of the 18 manufacturing segments reported growth in April compared with just 10 in March. Negative aspects included a 2.0 percent decrease in inventories and a 1.7 percent decrease in employment.
The Bureau of Economic Analysis reported that first quarter gross domestic product (GDP) for the U.S. increased at an annual rate of 0.2 percent driven by personal consumption and inventory investment, which were offset by decreases in exports, nonresidential fixed investment, and state and local government spending. Private businesses added $110.3 billion to their inventories in the first quarter, following increases of $80 billion in the fourth quarter and $82.2 billion in the third quarter of last year. Current challenges to economic activity include a strong U.S. dollar, lower crude oil prices, a West Coast ports slowdown and weakness overseas. In the fourth quarter of last year, GDP increased by 2.2 percent led by nondurable goods manufacturing; professional, scientific and technical services; and mining.
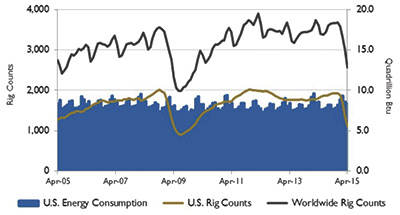 Figure 2. U.S. energy consumption and rig counts (Source: U.S. Energy Information Administration and Baker Hughes Inc.)
 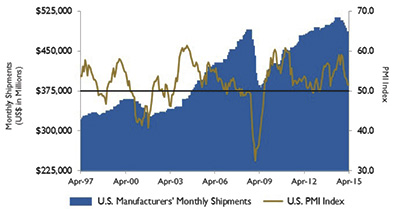 Figure 3. U.S. PMI and manufacturing shipments (Source: Institute for Supply Management Manufacturing Report on Business® and U.S. Census Bureau)
The U.S. Energy Information Administration predicts that domestic energy consumption will grow at a modest 0.3 percent per year through 2040, less than half the rate of population growth. The energy used in homes is expected to be flat, and transportation consumption is forecasted to decline 0.1 percent. Growth is predicted in both the industrial sector at 0.7 percent and the commercial sector at 0.5 percent. Energy efficiency standards combined with less travel due to technological and social factors account for the decline in the transportation sector. Gasoline consumption, which was 58 percent of transportation consumption in 2013, is projected to fall 21 percent by 2040 to be just 47 percent of total transportation consumption. Residential consumption is also impacted by energy efficiency standards as well as the population shift toward warmer climates.
On Wall Street, all indices were up slightly for the month. The Dow Jones Industrial Average gained 0.4 percent, the S&P 500 Index was up 0.9 percent, and the NASDAQ Composite rose 0.8 percent. Positive earnings from a broad range of companies, the European Central Banks' continued asset purchasing program and China's stimulus measures helped to raise investors' view of the market. First quarter earnings were up 4.9 percent for the more than 60 percent of S&P 500 companies that have already reported their earnings.
Reference
1. The S&P Return figures are provided by Capital IQ.