


The Jordan, Knauff & Company (JKC) Valve Stock Index was up 14.4 percent during the last 12 months, staying under the broader S&P 500 Index, which was up 22.1 percent. The JKC Pump Stock Index was up 24.1 percent during the same time.1
The Institute for Supply Management’s Purchasing Managers’ Index (PMI) increased 1.9 percentage points in August to a reading of 59.0 percent, its highest level since March 2011. The New Orders Index rose to its highest point since April 2004 with a reading of 66.7 percent. For the month, 14 of 16 industries reported growth in new orders—including plastics and rubber products, printing, nonmetallic mineral products, petroleum and coal, and fabricated metal products. The Production Index grew to 64.5 percent from 61.2 percent, showing a sixth consecutive month of expansion. Survey respondents were positive about business conditions but cited concern about global
political unrest.
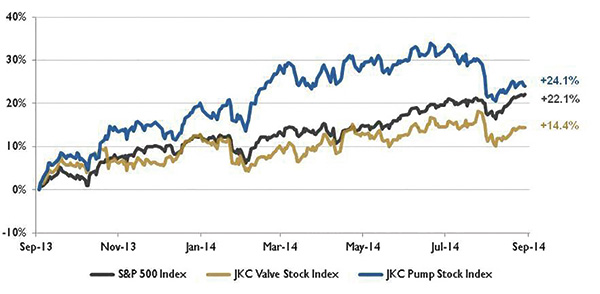 Figure 1. Stock indices from September 1, 2013, to August 30, 2014. Source: Capital IQ and JKC research. Local currency converted to USD using historical spot rates. The JKC Pump and Valve Stock Indices include a select list of publicly traded companies involved in the pump and valve industries weighted by market capitalization.
The Bureau of Labor Statistics reported that nonfarm payroll employment grew by 142,000 in August, much lower than the average monthly gain of 212,000 during the last 12 months. Professional and business services added 47,000 jobs in the month and 639,000 during the past year.Construction employment grew by 20,000, in line with its average monthly gains of 18,000 during the past 12 months. Health care and leisure and hospitality also had employment gains for the month. Following an increase of 28,000 in July, manufacturing employment was unchanged in August. Motor vehicles and parts and electronic instruments lost jobs, while gains were seen in computer equipment and nonmetallic mineral products.
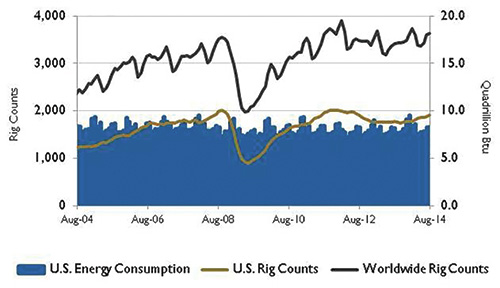 Figure 2. U.S. energy consumption and rig counts. Source: U.S. Energy Information Administration and Baker Hughes Inc.
Despite recent disruptions to the OPEC petroleum supply, which has tightened the world oil market, the U.S. Energy Information Administration (EIA) indicates that continued strong growth in non-OPEC supply will cause Brent crude oil prices to fall from an average of $108 per barrel this year to an average of $105 per barrel next year. Unplanned global supply disruptions remain at elevated levels and averaged 3.2 million barrels per day in July.
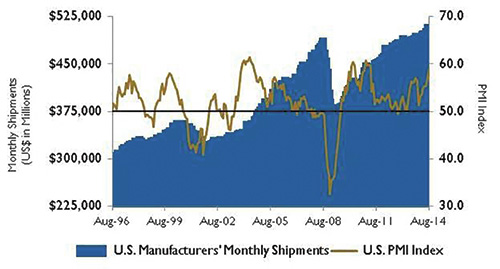 Figure 3. U.S. PMI and manufacturing shipments. Source: Institute for Supply Management Manufacturing Report on Business and U.S. Census Bureau
OPEC supply has fallen by 0.6 million barrels per day since June of last year primarily because of political unrest in Libya and Iraq. The EIA expects non-OPEC oil supply to grow by 1.8 million barrels per day in 2014 and 1.1 million barrels per day in 2014, with the U.S. and Canada supplying most of the growth. During the past two years, the combined supply from these two countries has risen from 14.7 million barrels per day to 18.2 million barrels per day.
On Wall Street, all three indices were up for the month of August, with the Dow Jones Industrial Average up 3.2 percent, the S&P 500 Index gaining 3.8 percent and the NASDAQ Composite rising 4.8 percent.
Despite geopolitical concerns around the world, investors were encouraged by economic data from the housing sector, factory orders and the trade balance.
Reference
1. The S&P Return figures are provided by Capital IQ.