


The Jordan, Knauff & Company (JKC) Valve Stock Index was up 9 percent during the last 12 months, staying under the broader S&P 500 Index, which was up 13.1 percent. The JKC Pump Stock Index was up 19.1 percent for the same time period.1
The Institute for Supply Management’s Purchasing Managers’ Index (PMI) increased 1.8 percent in July to a reading of 57.1 percent, its highest level since April 2011. The PMI has gradually increased each month since declining sharply in January 2014. The Production Index increased from 60 percent to 61.2 percent. The index for raw material costs moved higher to 59.5 percent from 58 percent and averaged 59.1 percent through the first seven months of 2014. This is a meaningful increase over last year’s average of 53.8 percent.
The U.S. Commerce Department reported that gross domestic product (GDP) rebounded in the second quarter of the year, growing at a 4 percent annual pace. Consumer spending on autos, appliances and furniture and business investment in technology and industrial equipment helped the economy grow. Historical numbers were also revised because the decline in the first quarter moved from 2.9 percent to 2.1 percent. The report also included revisions for the previous three years and showed that the underlying trend of economic growth was stronger than had been initially reported.
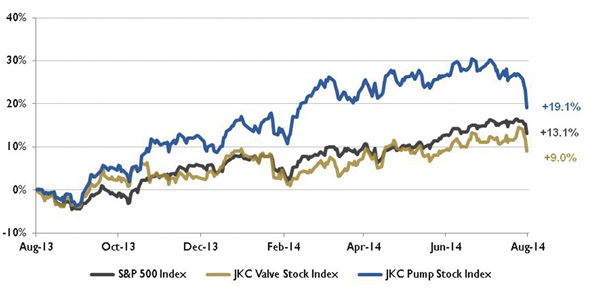 Figure 1. Stock indices from August 1, 2013, to July 31, 2014. Source: Capital IQ and JKC research. Local currency converted to USD using historical spot rates. The JKC Pump and Valve Stock Indices include a select list of publicly-traded companies involved in the pump and valve industries weighted by market capitalization.
Accounting for almost 40 percent of U.S. shale gas production, Marcellus natural gas production exceeded 15 billion cubic feet per day in July for the first time, according to the U.S. Energy Information Administration. Rising production resulted in a number of pipeline expansion projects that are required to remove bottlenecks in the region.
Marcellus production surpassed the winter demand for natural gas in Pennsylvania and West Virginia several years ago and is now expected to equal the demand in those states plus New York, New Jersey, Delaware, Maryland and Virginia. Increasing from 2 billion cubic feet per day in 2010 to its current level, Marcellus production has increased dramatically during the past four years.
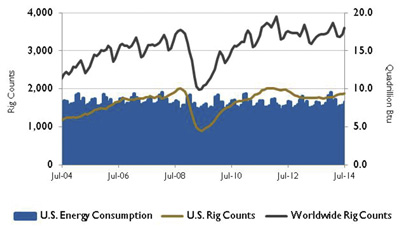 Figure 2. U.S. energy consumption and rig counts. Source: U.S. Energy Information Administration and Baker Hughes Inc.
Led by refineries in the Midwest and the Gulf Coast, U.S. refineries processed a record high 16.8 million barrels of oil per day in July, exceeding the previous record that was reached in the summer of 2005. Access to lower-cost crude oil, capacity expansions in the Gulf Coast region and increases in domestic demand and exports contributed to the higher refinery runs.
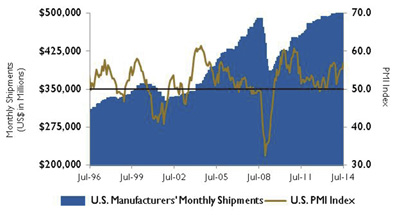 Figure 3. U.S. PMI and manufacturing shipments. Source: Institute for Supply Management Manufacturing Report on Business and U.S. Census Bureau
On Wall Street, the Dow Jones Industrial Average declined 1.6 percent for the month of July, while the S&P 500 Index lost 1.5 percent, the first monthly decline for both indices since January. The NASDAQ Composite fell 0.9 percent. Investors were worried about increasing geopolitical tensions in Gaza and Ukraine and expanded U.S. and European Union sanctions against Russia. Concerns about the European banking system and Argentina’s second debt default in 12 years also impacted the markets.
Reference
1. The S&P Return figures are provided by Capital IQ.