


Traditional control techniques examine the "running" status and the "not ready" status of the control circuit. While this method has served well for decades, it does have limitations. First, monitoring the contact of a starter does not detect if the wires have become disconnected, or if the linkage between the pump and motor is intact. Likewise, the "not ready" status will indicate an electrical problem is present, but it will not identify the problem, or how it occurred.
Why More Data
Troubleshooting can be costly. In 1997, Kellogg Brown and Root stated that 85 percent of troubleshooting time is spent on dead ends. Minimizing the time spent on dead ends minimizes troubleshooting time.
More information is needed to minimize the task. However, under traditional control schemes, each data point required a dedicated piece of equipment. For instance, if winding temperature was desired, a temperature switch, or sensor, would have to be purchased. Each piece of additional data added direct cost to the control system via the additional component, increased the labor times and impacted the panel size. The enclosure cost could be the single largest expense in a panel. Adding data points using traditional methods was perceived as prohibitive on all but the largest motors.
Advances in semiconductor technology created new techniques to measure data points at a dramatically reduced price, often with a negligible impact on cost, labor or panel size. Furthermore, maintenance labor dramatically decreased.
The cost of maintenance depends on the industry. According to results released by the Meta Group in October 2000, if the pumping system is in energy, then the cost can be $3,000,000 for each hour. However, if the pump is in water and wastewater, then the cost is about $750,000 for each hour.
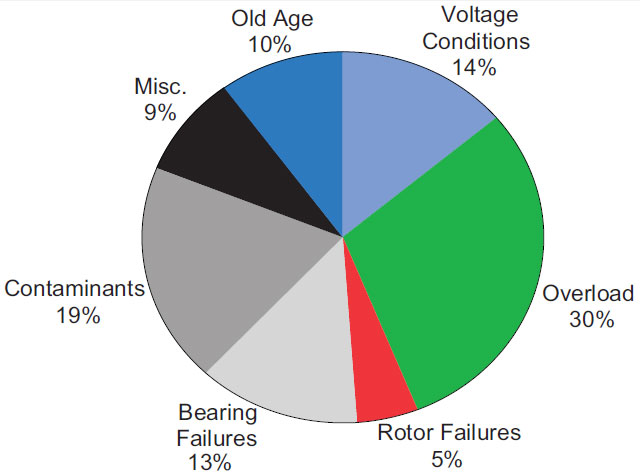
What data will help reduce troubleshooting time? Figure 1 from Cooper Bussmann reflects the causes of motor failures. This chart indicates that voltage conditions and overloads (which are related to torque) cause 44 percent of failures. The chart also shows that rotor failures, bearing failures, contaminants and some miscellaneous failures can impact torque. Pump failures can also create shaft, bearing, contaminant and other failures that impact torque. Torque changes will be reflected in current or power draw. Monitoring power, current and if possible power can detect 81 to 90 percent of motor failures, and some pump failures.
Available Technologies for Enhancing Data
Variable Frequency Drives
AC motors can have their speed changed if the frequency changes. Speed changes can modify pump capacity. A variable frequency drive (VFD) takes the standard 60 hz signal and converts it to a desired frequency. Drives analyze performance and create a collection of parameters. Other parameters can be sent to the drive to modify the drive's behavior. Electrical equipment suppliers design these drives to be used in a variety of industries. Some VFDs have as much as 858 parameters, but some of these parameters are not needed in pumping. Parameters for pumping include voltage, current, power, current at last fault, power at last fault, voltage at last fault and torque.
Motor Starters
If the system has constant speed motors, the answer is a motor management device. These devices perform data analysis and the function of an overload relay. They can be used where standard eutectic, bimetallic or solid state devices are used.
A motor management device will measure current and other factors. Like the VFD, these factors will then be converted to parameters that can be monitored. An expansion unit provides voltage measurement, and combines voltage with current to calculate power measurement.
Another method of constant speed control is to use a smart combined starter. These devices combine overcurrent protection, starter contacts and overload in a single device. They gather data in a similar manner to a motor management device, but may vary in the parameters that can be monitored. Some of these devices can provide enhanced fault protection that can lead to a limited number of restarts after an electrical fault without requiring a rebuild or replacement of the starter.
What To Do With the Data
In a traditional control method, two parameters (motor "run" status, and motor "not ready" status) were used per motor. In the new method, perhaps ten or more parameters are used. This is a mix of discrete and value-based (analog) parameters.
In a system with 100 motors using the traditional method, there would be 200 data points. The same system with the new method would have 1,000 data points (assuming 10 points per motor) or more. This five-fold increase in data requires careful management to be useful.
Data management is where many intelligent-based pumping systems fall short of their full potential. There are three approaches to gathering pump data: local, remote and hybrid.
The local approach is applied in standalone pump systems. In this method, some means is provided to gather, monitor, trend and organize the data. The advantage is that the data is locally available to enhance maintenance. This includes not only instantaneous data, but also historical data. Someone can see how the system performance has changed over time, and react accordingly.
To do this, a PC-based HMI can be placed into a panel. This terminal would run SCADA software. However, this might be cost prohibitive for small- to medium-sized systems. Another way is to use a web-enabled device. These gateways gather data from the drives and motor starters and present the information in webpage format. The webpages could include trend graphs, alarm tables and basic operational pages with instantaneous readouts. Once these webpages are developed, they can be accessed with a standard browser. Browsers come standard with new PCs. Using these browsers minimizes cost, and eliminates the compatibility issues that can be encountered with some software as operating systems change over time.
Once the data is gathered into the webpages, the system owner can decide whether to have the pump system isolated, or connected to the Internet. There is value to both approaches. However, that discussion is beyond the scope of this article.
The remote approach involves taking the data from the devices and transferring it to a central repository. The data is then typically managed via PC-based SCADA software. The benefit is that the data from multiple systems can be displayed at a central site. This eliminates the need to travel to various pumping systems for performance data. This method has two drawbacks. The first is that the data is not available for local diagnostics. The second is that the amount of data requires a high speed network such as Ethernet to function properly. If this is not already present, then the implementation cost must be carefully considered.
The hybrid approach is a combination of the two approaches described above. This provides data locally and remotely simultaneously. Within this approach, two sub-methods exist.
One sub-method is to have the web gateways locally, and only a bare minimum amount of data transmitted remotely. This method can take advantage of the slower serial networks that are still common, while providing the enhanced data collection locally. The drawback is that the remote location cannot see all the parameters, so a maintenance person dispatched to handle an anomaly may not be fully prepared for the situation at the pump system.
The other sub-method is to have a high speed network installed, as well as local gateways. In this method, a maintenance person can have access to the latest data via a browser locally, but the same data is viewable remotely. This provides a seamless operational view, while minimizing software costs to only the main SCADA terminals. However, as stated before, the disadvantage is that a high speed network must exist to the remote SCADA system.
Once the method is determined, care must be taken to ensure that the data needed is gathered and analyzed properly. This, not the approach method, is where advanced information systems fall short. Pumping, especially in water and wastewater, is a bid-intensive field. To remain competitive, many pump system suppliers must provide the minimum capability to meet their interpretation of the contract documents. For example, if the specification says, "Provisions will be made to display drive parameters in a local gateway, and remote SCADA," a pump supplier may include the local gateway and connection method to a remote station, but not provide the programming or webpage development. The pump system supplier has met the specification because the provision has been made.
However, if the designer wanted webpage development, then this interpretation difference can cause debate during implementation. Make sure to specify exactly what data needs to be monitored and how. This will help ensure that the proper webpages are developed and delivered.
Traditional control technologies provided minimal information to be monitored, and more advanced data came with an added cost. Today's technology offers added data at a negligible cost. However, care must be taken to analyze how this data is gathered and displayed to obtain maximum impact while minimizing implementation cost. The result is a system whose maintenance can be significantly minimized.
How Information Saves Maintenance Cost |
Given: A motor has registered a "not ready" signal.
Case 1:
Steps: A truck heads to the pump station, and a reset is engaged. This does not work. The motor circuit breaker is repeatedly re-engaged and trips immediately. This breaking is too rapid for the instantaneous meter. A meter with Min and Max capability is used. The Max reading is well beyond the running limits. The pump is removed from the motor and the problem still exists. The starter is examined, and the wires to the motor are tested for conductance and insulation between phases. The results are normal. The wiring inside the pump is examined, and bad windings are found. Further testing also uncovers bad bearings.
Result: Ten hours of troubleshooting including reset and drive time. In a wastewater utility, this results in $7.5 million of maintenance time.
Case 2:
Steps: A truck heads to the pump station and a browser is connected to the pump panels. A high voltage spike is recorded in the fault record. It is suspected that the insulation in the windings is bad. The motor is tested and shorted windings are found. While investigating the data, a small but continuous amp curve is noted. The bearings are repacked as a precaution.
Result: Troubleshooting takes three hours, at a cost of $2.25 million.
Pumps & Systems, June 2010