


When it comes to pressure and flow, variable speed pumping applications can be divided into three basic categories. Constant pressure-variable flow (Cp-Vf) attempts to keep pressure relatively constant over a range of flows. Constant flow-variable pressure (Cf-Vp) tries to achieve the opposite by using varying pressure to keep flow constant. Variable pressure-variable flow (Vp-Vf) applications can accommodate a change in both.
Selecting the best pump for these applications requires the generation of a system curve and a thorough evaluation of the performance curves produced by the potential pumps. Plotting the variable frequency curves against the system curve provides a view of actual performance.
This month, we will review a pump selection process for Cp-Vf applications that I have used successfully for many years. I am sure that many of you have developed your own processes, and I look forward to your comments and comparisons.
Constant Pressure-Variable Flow
One of the most common examples of Cp-Vf is the pressure booster system. These systems are designed to supply a wide range of flows, at some constant pressure, in buildings, subdivisions and industrial applications. They are also one of the most likely applications to be adapted to variable speed operation.
In the typical pressure booster system, pressure is measured at the discharge manifold. Because of this, the system curve is flat and has the same value of H for all values of Q. Some, however, measure pressure well downstream to counter the effects of elevation changes and friction head. This results in a more complex system curve and often requires a more sophisticated control system. For this particular column, we will assume pressure is measured at the discharge manifold. We will also limit our discussion to single pump control. Although pump selection is similar for multi-pump/VFD systems, we will address them in detail in another column.
Curve Shape
Although the shape of the performance curve is not a major factor in some variable speed applications, it becomes important when the desired result is Cp-Vf. Steeper curves, or those that exhibit a significant increase in head from the maximum operating point to the minimum operating point, allow a wider range of control and a potentially larger reduction in energy consumption. As a rule, I like to see a 50 percent increase between these two points. Figure 1 is an example of a flat performance curve.
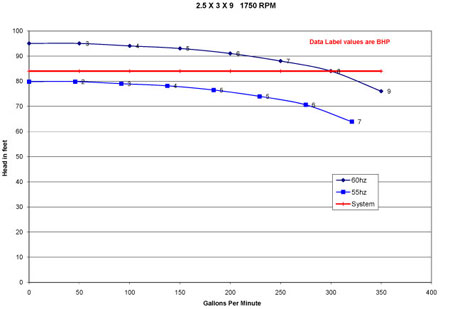 In this example, the application calls for a pressure boost of 84-ft over a flow range of 100- to 300-gpm. The red line is the system curve while the black and blue curves show pump performance at 60- and 55-hz. Due to its flatness, the 55-hz curve does not intersect the system curve at any point. The head rise over the flow range is just 10-ft (12 percent) and corresponds to control range of about 3-hz. Such a small range will not allow any measurable reduction in power consumption. As a rule, I like to see a minimum control range of 10-hz for most variable speed applications.
On the other hand, this particular pump could be the poster child for PRV control. Since the head rise is so small, BHP is reduced substantially at each reduced flow point. There are applications in which PRV control can work very well.
Other Factors
As with any application, hydraulic efficiency is an important consideration, but it can be even more important in variable speed applications because BEP takes on an additional dimension. It moves to the left with a reduction in speed, so if a pump is 75 percent efficient at 600-gpm, there is a good chance it will have the same efficiency at 500-gpm. In addition to high efficiency, the ability of the pump to operate to the right of BEP can contribute to a higher average operating efficiency. Figure 2 illustrates the effect of curve shape and these other factors.
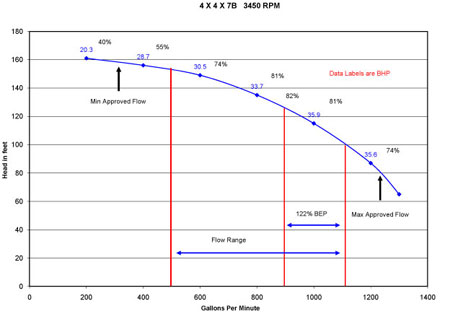 Figure 2 shows a pump under consideration for a constant pressure application that requires flows of 500- to 1,100-gpm at a boost of 100-ft. Although there will be some periods with flows of 1,000- to 1,100-gpm, typical flows will fall in the 600- to 900-gpm range.
How well does this pump meet the requirements we have discussed? The curve exhibits a rise of about 54- ft (54 percent) from 1,100- to 500-gpm, so control is optimized and power savings should be significant. BEP efficiency is excellent at 82 percent. The maximum flow point is 122 percent of BEP flow, which is well below manufacturer-approved flow, and efficiency is a healthy 78 percent. This allows us to place BEP flow in the area where typical flow occurs. The efficiency at the low flow point is just 66 percent, but it improves significantly under VFD control. Overall, this pump appears to be a good candidate. All that remains is to review its actual performance.
Figure 3 shows the actual performance by plotting the variable frequency curves against the system curve. The points at which the frequency curves intersect the system curve will be the flow point for that frequency. The control range is approximately 49- to 60-hz (12-hz) over the entire range of flow. Even at a relatively low resolution of 1/10 hertz, there will be 110 individual operating points.
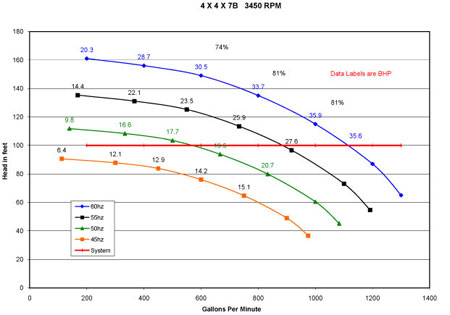 As illustrated by the 60-hz, 55-hz and 50-hz curves, the three major efficiency points move to the left as frequency is reduced. This results in a minimum efficiency of 80 percent for flows between 650- and 1,000-gpm. The absolute minimum efficiency occurs at 500-gpm, but is increased to 74 percent due to the leftward migration of the 600-gpm/60-hz point. The efficiency is 78 percent at maximum flow, and the average efficiency across the entire flow range is 79 percent. As shown by the data labels, these high efficiencies result in a substantial power savings compared with PRV control. For example, at a midrange flow of 800-gpm, the BHP required is 24.9 at 53-hz versus 33.7 at 60-hz.
The Excel spreadsheet (PPSA) used for Figure 3 can be downloaded from my website. Next month we will review a pump selection process for Vp-Vf applications.