


A Simplified Method for Monitoring Pump Performance
Pump users should regularly monitor the condition of their critical centrifugal pumps to keep them operating efficiently. Otherwise, lost production, product releases, or fires could occur.
However, monitoring performance in the field has always been a challenge due to an absence of field-mounted instrumentation, the time required for testing, and imprecision from the cumulative uncertainty of all performance variables involved.
A practical, cost-effective, and environmentally-friendly method can determine the pump’s health and whether repairs are economically justified. The simplified pump performance assessment method described here, as researched by D. Budhram, M. Russek, and myself, is based upon comparing expected horsepower consumption with actual horsepower consumed at a given pump flowrate.1 Process pressure measurements are not required.
Background
Traditionally, machinery engineers have used the following equation to assess centrifugal pump efficiency:
η = pump efficiency =
flow x head x
(specific gravity ÷ brake hp) x 3,960
(Equation 1)
This method is often used for pumps with electric motor drives, since the brake horsepower can readily be determined using the following equation2:
bhpmotor = (V x I x PF x √3 x ηFL) ÷ 746
where: V = voltage
I = current
PF = power factor
ηFL = motor full-load efficiency
(Equation 2)
This method can be quite challenging due to the numerous variables involved and the difficulties surrounding flow and pressure measurements. Flow presents problems because flowmeters are not always found in the field, or those available are hampered by uncertainties of 5 percent or more. Pressure is a challenge because the analyst must verify gauge accuracy before each usage, locate a pressure connection close to the pump, and deal with process leakage associated with installing and removing the pressure gauge.
You must measure six variables (flow, suction and discharge pressures, specific gravity, voltage and amperage) in the field and know the motor efficiency and motor power factor variables to calculate pump efficiency with reasonable confidence. This collection of uncertainties can lead to an efficiency uncertainty greater than the efficiency loss in question.
An alternate method of assessing pump performance evolved from ideas suggested by Bloch3 and Lightle and Hohman4. For specific speeds (Ns = N x Q1/2 / H3/4) from 200 to 3,000, they suggested that pump horsepower requirement increases as wear ring clearances increase (see Figure 1).
Figure 1. Horsepower losses and consumption increases as wear ring clearances increase.
This is intuitive, since pumps with low specific speeds tend to generate more pressure per stage and experience more leakage between stages than similar-size pumps with higher specific speeds.
This internal leakage is very sensitive to actual wear ring clearance, which can change with time due to wear. We can model this by depicting internal leakage as a spillback line from discharge to suction (see Figure 2).
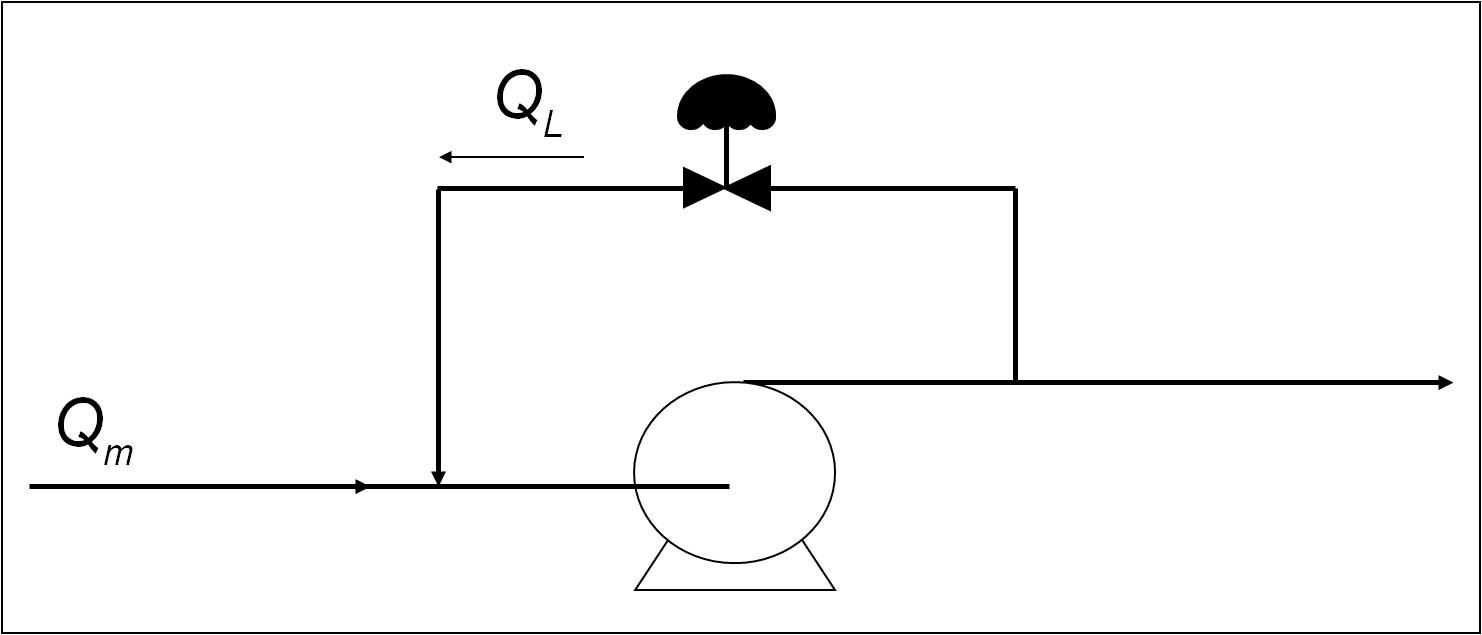
Figure 2. Internal leakage can be modeled as a spillback line from discharge to suction.
As the internal seals wear, internal leakage increases, as depicted here by opening a valve in a spillback line. This recirculation flow, QL, leads to lost horsepower. As Figure 3 shows, for an overall measured flow, QM, how internal leakage, which is depicted as spillback line flow, QL, leads to a lower differential head across the pump and an increased horsepower requirement. The process “sees” QM as the net flow, but the pump “senses” that it is pumping QM +QL, thus requiring more horsepower than expected.
Figure 3. Internal leakage increases horsepower requirements.
If you rewrite Equation 1 in terms of horsepower you get:
bhpexpected = (flow x head x specific gravity) ÷ (3,960 x pump efficiency)
(Equation 3)
If we select a certified performance curve for a given pump and specific gravity, we can say that head, H, and efficiency are functions of flow. Therefore, we can write:
bhp = (flow x H(flow) x specific gravity (constant)) ÷ (3,960 x η (flow))
(Equation 4)
For a given certified performance curve with a set fluid, brake horsepower is strictly a function of flow – assuming that the pump is in “new” or ideal condition. To assess a pump’s condition at a given flowrate, you must compare actual horsepower consumed with ideal horsepower predicted for a given pump. Only flow is required, but an elimination of variables causes a loss in some performance insight. To understand the method’s limitation, we will examine what conditions are required, what assumptions are made and what is being lost along the way.
Requirements
The following conditions and assumptions are required to use the simplified method:
- The pump must have a specific speed less than about 3,000. Horsepower rises as flow increases in pumps with specific speeds in this range. Pumps with specific speeds above this have flat or negative horsepower slopes (see Figure 4)5.
- The pumped fluid must have low viscosity in order to eliminate viscosity as a factor.
- The pump must have a motor driver.
- A certified performance curve is required and essential. The certified performance curve provides a highly accurate horsepower versus flow curve for your pump’s “new” condition.
- The pump evaluated must be identical in impeller type and diameter to the pump that was certified. If a larger (or smaller) impeller were installed without your knowledge, you would quickly know it by measuring pump differential pressure. The simplified method would emphasize that the horsepower requirements are greater (or possibly smaller) than expected. One way of solving this problem is to use this simplified assessment method as a screening tool. If you find a large discrepancy between measured and expected horsepower, you can measure the pump’s differential pressure as a second check of pump performance.
- Assumption: Performance deterioration from the “new” condition is primarily due to increased seal leakage. For low-viscosity, relatively clean pumpage, this assumption is reasonable. If this assumption is valid, then returning the pump wear rings back to manufacturer’s specifications will restore most or all of the lost efficiency. It is certainly possible to lose efficiency due to impeller or casing erosion, fouling, poor inlet flow distribution or other means. Keep in mind that problems other than excessive internal leakage could be manifested in different ways. An inlet flow distribution problem will result in a constant efficiency offset that can never be eliminated. Fouling could decrease horsepower consumption if it sufficient to act as a flow restriction inside the pump.
90 percent of process pumps should meet these conditions.
Figure 4. Pumps with Specific Speeds above 3000 have flat or negatively sloped horsepower curves.
Data Collection
The first step in using this method is collecting field data, including flow and electrical pump measurements. Due to the advent of portable clamp-on transit-time flowmeters, pump flow measurements can be readily obtained quickly, accurately and noninvasively. Doppler flowmeters can also be used; however, they are not considered as accurate as transit-time flowmeters.
After flow measurement, collect the electrical motor data: voltage, current and power factor. Voltage and current values are read from portable or field-mounted voltmeters and ammeters. The power factor can be determined in one of two ways. First, read it from a power meter if one is available. Alternatively, interpolate between two known values; values at 100 percent, 75 percent and 50 percent of full load are typically provided on the motor specification sheet.
Small motors less than 200-hp do not usually have ammeters and voltmeters installed on them. An electrician is required to open the motor starter door to measure the line-to-line voltage and current using a portable voltmeter and ammeter.
On larger motors, greater than 200-hp, the starter door cannot be opened due to safety considerations. Opening the starter door triggers a fused switch which leads to motor shutdown. Typically, large motors usually have voltmeters and ammeters located in motor control centers or on the motors themselves, making collecting the electrical data a matter of reading values from the instruments.
Data analysis
Expected horsepower consumption at the measured flow is calculated with Equation 3. Another means of determining expected horsepower is to use interpolated brake horsepower values from the certified test data, if available. For pumps with flat horsepower curves, we decided not to estimate brake horsepower from the curve due to interpretation errors.
With a measured value for flow, you can use the pump performance curves to determine head and efficiency for “as new” conditions. The specific gravity can be determined by laboratory analysis results of product samples. These analyses are usually done on a set frequency.
Electrical motor data provides information for the actual horsepower supplied. After measuring voltage and current, you use the motor data sheet (found in the equipment records book) to obtain full-load efficiency and power factor values. An alternate method using full- and half-load amps can also be used if power factor data are unavailable. Equation 2 is the kilowatt ratio technique that has been adapted to provide power supplied by the motor.
Once these steps are followed, the following equation calculates losses within the pump:
hplosses = bhpmotor - bhpexpected
(Equation 5)
By monitoring horsepower losses over time, pump overhauls can be justified by striking a balance between losses due to extra energy consumption and repair costs.
Pumps & Systems, October 2006
WORKS CITED
1 Discussion referenced first appeared in the August 2002 issue of Hydrocarbon Processing.
2 U.S. Department of Energy and Bonneville Power Administration, Replacing an Oversized and Underloaded Electric Motor, Fact Sheet.
3 Bloch and Geitner, Major Process Equipment Maintenance and Repair, Gulf Publishing, 1985.
4 Lightle and Hohman, “Keep pumps operating efficiently,” Hydrocarbon Processing, September 1979, pp. 227-229.
5 Karassik, Krutzsch and Fraser, Pump Handbook, McGraw-Hill, 1976.
WORKS CONSULTED
6 Spitzer, D.W., Practical Guides for Measurement and Control, New York: McGraw-Hill, 1996.
7 Dufour and Nelson, Centrifugal Pump Sourcebook, McGraw Hill, 1992.
8 Rosemount, DP Flow Accuracy, DP Notes Volume 1, Issue 6, 1998.