


Vibration analysis trending can be a helpful tool in predicting brewing problems, before they develop into a big issue. The Kemira/FinnChem plant (Kemira) in Augusta, Ga., started a vibration monitoring program in 2008—first for several critical cooling water pumps and later included other types of rotating machinery. This type equipment can take several days to repair. Kemira's objective was to catch the issues prior to breakdown and then efficiently plan downtime to correct the issues.
Data Collection
Monthly data was collected, typically at four train locations: driver (motor) inboard and outboard bearings and pump (or similar driven machinery) inboard and outboard bearings. At each location, overall (RMS value) vibration data is taken in three directions: horizontal, vertical and axial. Data is collected by technicians and entered into a data tracking trending program, with password access via web by Kemira plant engineers and maintenance personnel. See Figure 1.
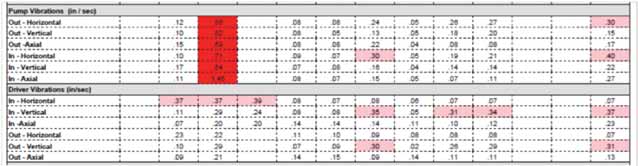
Figure 1
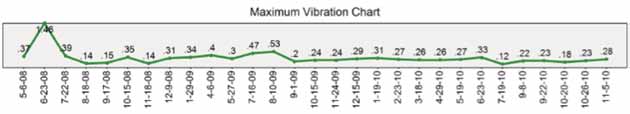
Figure 3
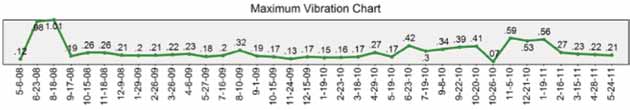
Figure 4
Data Interpretation
Kemira's employees interpreted the data by listening to immediate issues that the service technician recorded or noticed in his analysis. They also looked at the trends to try to predict or plan maintenance on equipment before failure. The software database provides monitoring for several months at a time.
However, reading and reviewing 12 data points for each pump can be confusing. Therefore, only a maximum value (for example, 1.46 inches/second RMS in Figure 1, for the readings made on 6/23/08) is plotted on the chart in Figure 3. This allows Kemira to see immediate issues or problems.
Color coding helps zoom into the problematic area and not waste time reviewing the normal data. In Figure 1, 0.30 inch/second is for warning level (pink) and 0.50 inch/second for alarm level (red). In general, warning and alarm levels depend on the type of the equipment, power level and other factors. The data can be adjusted to reflect a more exact criteria if required. However, in Kemira's case, focusing mainly on the “worst actors was more practical. This way, they could be addressed first and then move onto the next level, then to lower-level problems. With this approach, the 0.30 and 0.50 inch/second criteria worked for the company.
Blower Bearing Failure
Looking at Figure 3, Blower A experienced a bearing failure, which was identified on 6/23/08. With corrective action (bearing being replaced), the trends returned to normal (below 0.30 inch/second). A similar issue happened in the summer of 2010. Corrective action was taken, preventing a catastrophic failure of Hydrogen Compressor B.
Monthly analysis allows Kemira to interpret the data and take action, while at times making the decision not to take action if appropriate and to schedule corrective action at a more convenient time, such as during scheduled maintenance.
Extreme Compressor Vibration
Another example occurred when a hydrogen compressor experienced extreme vibration warnings. Kemira allowed the unit to continue operation after the 6/23/10 level exceeded the warning (0.33 inch/second > 0.30 inch/second). The next month, the vibration level returned to normal after the belts were tightened, and the motor and flywheel were aligned. With this approach, other parameters can be monitored to help decide when and what action is taken.
Figure 2
For example, the vibration levels were somewhat elevated in 2010. The technicians knew that the vibration reflected other system-related issues, which they could not alter at the time. In 2011, the system was fixed. The vibrations returned to normal, without corrective action on the unit.
Cooling Water Pumps
Another example are six cooling water pumps. Unit D experienced very high vibrations and was once repaired (failed bearing around June 2008). Later, as Kemira technicians examined it and determined that the repair was not practical because cavitation had damaged much of the impeller and the casing. They decided to replace it. See Figure 4.
In this case, vibrations re-occurred in the winter of 2010 due to significantly throttled pump operation reflecting the reduced need for cooling water. As the weather warmed and the pump retuned to a more normal operation, vibrations diminished, see the trend chart in Figure 4.
Results of the Monitoring
The trends helped Kemira identify other issues, related to the pumps and the system. The initial objective to improve reliability provided hints regarding the overall operation of the plant's machinery—including system effects and efficiency considerations. Technicians are now studying the pumps' operation more closely to see what modification can help the pumps operate closer to the best efficiency point (BEP).
With the plant engineering and maintenance working closely with the vibration analysis pump experts, the company could view the issues from different perspectives, resulting in a better understanding of the overall operation and improved reliability, plant uptime and energy efficiency. Other aspects of this work, such as the more expanded vibration analysis (FFT spectral analysis) will be in this column in an upcoming issue.
Pumps & Systems, September 2011