If you are new to the pump arena, you may be a bit taken back by the number of pump models offered by various pump manufacturers. When you take a look at their performance curves, you will see that they come in a plethora of shapes and sizes.
The shape of a centrifugal pump curve is dependent upon that somewhat nebulous quantity known as specific speed. In simplest terms, this dimensionless number gives the pump designer an idea of where to start when designing a pump for a particular application. As a rule of thumb, lower specific speeds produce flatter curves, while higher specific speeds produce steeper ones. In between, there is almost every angle you can imagine.
Many pumps are designed with a particular application in mind. Often the goal is to achieve the highest possible efficiency at the design point. In these "single point" designs, the shape of the curve is often irrelevant. But in the real world, many of our applications are not single point, and flows can vary from near shutoff head to 10 percent over BEP. In these applications, curve shape can be an important consideration during pump selection.
Curve shape is important for several reasons. One involves power consumption as flow moves to the left of the design point, and another has to do with pump control. Yet another involves the overall system in which the pump operates. Let's take a look at a couple of typical applications and show how curve shape can affect their operation.
Constant Pressure
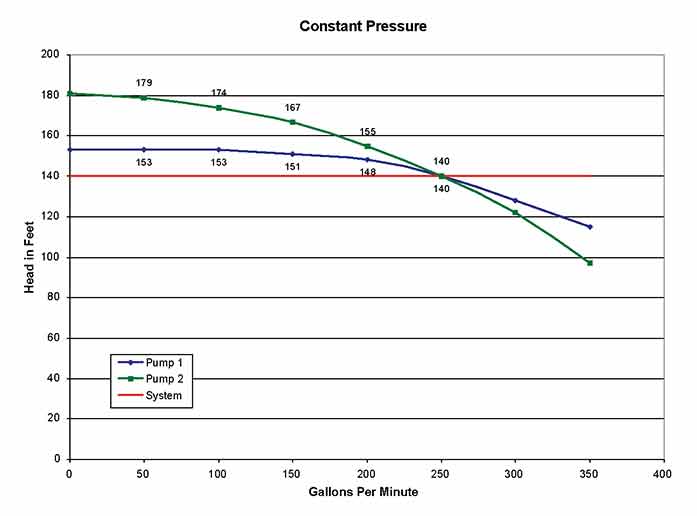
Figure 1 shows two different pumps operating in a constant pressure application. Although the two performance curves appear similar, the curve produced by Pump 1 is relatively flat across its range of flow, while the curve of Pump 2 falls more sharply from shutoff to full flow.
 Figure 1
The red horizontal line represents the pressure that is to be maintained across the range of flow. Both are real pumps and have a manufacturer-approved flow range of 50-gpm to 300-gpm. They also have similar efficiencies at the major flow points.
So which curve is best? Well, it depends upon the application. If pressure is maintained by a PRV and the system runs continuously, Pump 1 is the better choice. Both require about 12.4-hp at 250-gpm, but at intermediate flows, Pump 1 consumes less power. The reason for this is because Pump 2 operates at a higher head at these intermediate flows and the BHP required is directly proportional to head (BHP = flow x head / 3960 x efficiency).
For example, at 100-gpm Pump 1 consumes 7.4-hp, while Pump 2 requires 8.3-hp. In fact, if you could live with a small change in pressure (5.5-psi) across the range of flow, Pump 1 could even eliminate the expense of the PRV!
Suppose, instead of continuous operation, we want to use a simple pressure switch to shut the system off when flow drops to 50-gpm. In this case, Pump 1 would be difficult to control because the pressure differential between full flow and shutoff head is less than 6-psi, and there is essentially no pressure differential below 150-gpm. However, Pump 2 will operate successfully in this application even though it will consume a bit more power. The same would be true for a duplex booster system. There must be adequate differential pressure in order to sequence the pumps with a pressure switch. For this reason, flow switches are often used in PRV-controlled booster systems that incorporate pumps with flatter curves. When a VFD is employed in a booster system, we tend to select pumps with even steeper curves because they allow use of a much broader frequency range that allows more precise control.
Pump Down
Pump down (or pump up, if you use reverse logic) applications are seen throughout the wastewater industry. They employ a wet well or pit to collect the wastewater and then "pump it down" once it rises to some predetermined level. The wet well is designed to accommodate the varying inflows that can occur during the day and also provide some minimum run time in order to reduce the number of pump starts.
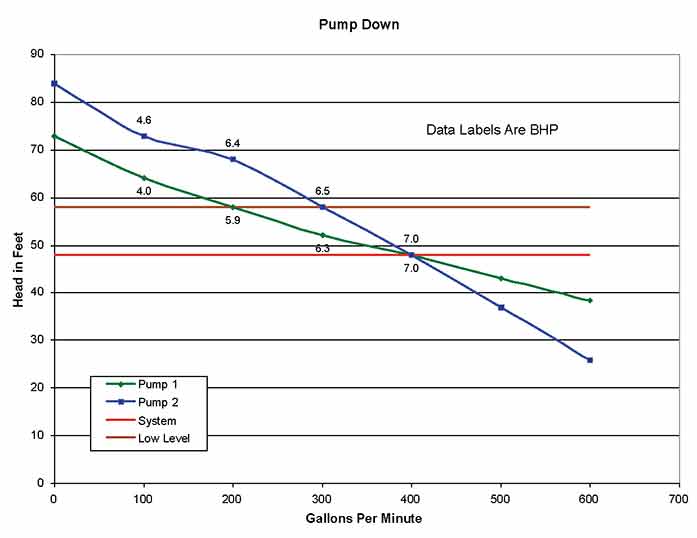
Figure 2 shows two different pumps operating in a pump down application. The red horizontal line at 48-ft represents the static head seen by the pumps when the wet well is full, and the brown line at 58-ft represents the additional head required to pump it down to the minimum level (10-ft pump down). Again, these are real pumps and both have the same efficiency at their maximum flows. The data labels on the two curves show the BHP consumed at that flow point.
 Figure 2
Pump 1 begins the pump down cycle at a flow of 400-gpm and shuts off at a flow of 200-gpm. Pump 2 has a somewhat steeper curve and starts at the same flow, but ends at just 300-gpm. Let's assume that our wet well has a diameter of 8-ft 3-in, which would equate to a volume of 400-gal per vertical foot and a total pump down volume of 4000-gal. How long will it take each of these pumps to reach the shutoff level?
It takes Pump 1 about 1.04 minutes to pump down the first foot of water and the last foot takes about 1.9 minutes. If you calculate the time required for each foot in between, you would find that the entire pump down cycle takes about 14.5 minutes.
Pump 2 can remove the first foot in about 1.01 minutes and the last foot takes about 1.3 minutes. Once again, the math tells us that the entire cycle takes about 11.6 minutes. This means Pump 1 takes about 25 percent longer to complete the pump down cycle. So which is the better choice? It depends upon what you are trying to accomplish.
Both pumps have the same maximum flow, so neither has an advantage when it comes to staying up with potential inflow. A big difference occurs in the pump down time of the two pumps. I said earlier that a wet well is designed to supply a volume that will provide some minimum run time for the pump and thus reduce the number of starts it will experience over some period of time.
Since Pump 1 takes considerably longer to evacuate the 4,000-gal wet well used in our example, the well could be sized for a smaller volume and still maintain a reasonable minimum run time. This could reduce the first cost of the wet well or allow its installation in an area where a larger diameter might not be accommodated. Both are valid reasons for selecting Pump 1.
Pump 2 and its faster pump down also have an advantage: power consumption. "Wait," I hear you say, "if there is any power savings, it must be on the side of Pump 1. After all, it requires a lower horsepower than Pump 2 across the entire pump down cycle." That is true, but we have to look at power from another perspective in order to see what is really happening.
Rather than looking at gross horsepower, let's take a look at the horsepower required per gallon of pumpage. Both pumps require 7-hp at the beginning of the pump down cycle. At 400-gpm, this equates to about 0.0175-hp/gal pumped. At the end of the pump down cycle, Pump 2 is pumping 300-gpm and consumes about 0.0217-hp/gal. At this same point, Pump 1 consumes about 0.0210-hp/gal, or about 3 percent less than Pump 2.
But at the 300-gpm point, Pump 1 has reduced the level by just 4-ft. After removing another 2-ft, its flow is 260-gpm and its power consumption has increased to about 0.0236-hp/gal. After removing another 2-ft (a total of 8-ft), flow reduces to 230-gpm and power rises up again to 0.026-hp/gal. It finishes the pump down cycle at 200-gpm with a power consumption rate of 0.0295-hp/gal.
If you calculate the total power required by each pump, you will find that Pump 1 consumes about 16 percent more energy than Pump 2 during the complete pump down cycle. If you want to reduce power consumption, use that larger wet well and install Pump 2.
These are just a couple of examples of how curve shape can affect pump selection. There are many more. It is not just shape that is important. In last month's column, I mentioned that the breadth of the efficiency curve should also be considered. If efficiency decreases slowly, lower flows will require less energy.


