


The Jordan, Knauff & Company (JKC) Valve Stock Index was up 1 percent over the last 12 months, below the broader S&P 500 Index which was up 5.8 percent. The JKC Pump Stock Index was up 10.8 percent for the same time period.
The Institute for Supply Management‘s Purchasing Managers Index (PMI) registered 50.8 in October, a decrease of 0.8 compared to September's reading of 51.6. The New Orders Index increased to 52.4, 2.8 over September, indicating a return to growth after three months of contraction.
The labor market is still growing at a sluggish pace. The Bureau of Labor Statistics reported that overall nonfarm payrolls increased by 80,000 in October. Following two months of decline, manufacturing added 5,000 workers, led by the durable goods sector. While the number of jobs added was slightly below expectations, the overall unemployment rate decreased slightly from 9.1 percent in September to 9.0 percent in October.
The Commerce Department reported that the real gross domestic product (GDP) grew 2.5 percent in the third quarter, considerably better than the 1.3 percent in the second quarter and the 0.9 percent rate of growth for the first half of 2011. Personal spending, business investment and exports helped lift the number.
The U.S. Energy Information Administration is forecasting that world crude oil and liquid fuels consumption will grow from a record level of 87.1 million barrels per day in 2010 to 88.2 million barrels per day in 2011 and 89.6 million barrels per day in 2012. China and other emerging economies account for all the projected growth. The number of oil rigs in operation continued to increase with rig counts in the U.S. at 2,017 and worldwide rig counts increasing to 3,722.
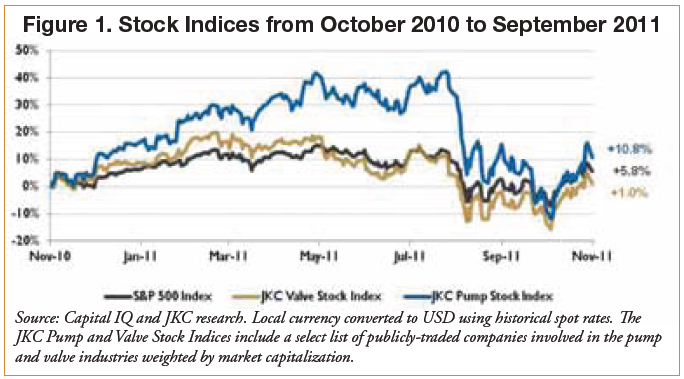
Figure 1. Stock Indices from October 2010 to September 2011
Source: Capital IQ and JKC research. Local currency converted to USD using historical spot rates. The JKC Pump and Valve Stock Indices include a select list of publicly-traded companies involved in the pump and valve industries weighted by market capitalization.
Oil prices continue to face upward price pressure because of supply uncertainty due to ongoing unrest in the Middle East and North Africa. However, downward price pressure may occur due to a number of factors including: weakening global economic growth, contagion effects of the debt crisis in the European Union, fiscal issues facing national governments and if Libya is able to ramp up oil production sooner than anticipated.
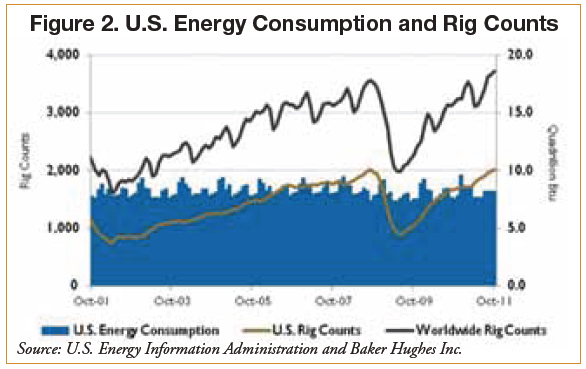
Figure 2. U.S. Energy Consumption and Rig Counts
Source: U.S. Energy Information Administration and Baker Hughes Inc.
On Wall Street, stocks had their best month in almost a decade, rising from their low point of the year in an almost uninterrupted four-week rally due to news that Europe appeared to find a strategy for dealing with its debt crisis. The Dow gained 9.5 percent, while the S&P 500 index rose 10.8 percent.
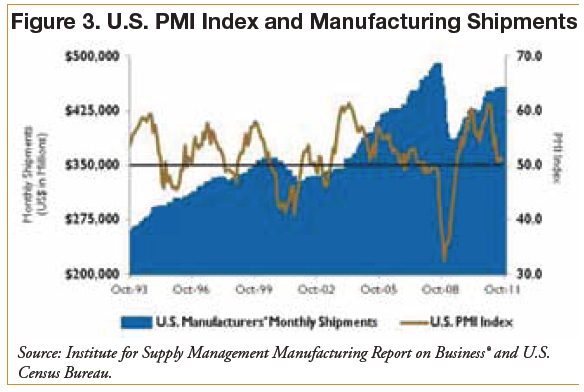
Figure 3. U.S. PMI Index and Manufacturing Shipments
Source: Institute for Supply Management Manufacturing Report on Business® and U.S. Census Bureau.
Pumps & Systems, December 2011
These materials were prepared for informational purposes from sources that are believed to be reliable but which could change without notice. Jordan, Knauff & Company and Pumps & Systems shall not in any way be liable for claims relating to these materials and makes no warranties, express or implied, or representations as to their accuracy or completeness or for errors or omissions contained herein. This information is not intended to be construed as tax, legal or investment advice. These materials do not constitute an offer to buy or sell any financial security or participate in any investment offering or deployment of capital.