


Pumps & Systems, April 2013
The Jordan, Knauff & Company (JKC) Valve Stock Index was up 12.9 percent during the last 12 months, above the broader S&P 500 Index which was up 10.2 percent. The JKC Pump Stock Index was up 9.2 percent for the same time period.1
In February, the Institute for Supply Management’s Purchasing Managers’ Index (PMI) reached its highest level since June 2011, increasing to 54.2 percent from January’s 53.1 percent reading. This indicates manufacturing expansion for the third consecutive month. The New Orders Index registered 57.8 percent, an increase of 4.5 percent over January’s 53.3 percent, suggesting growth in new orders for the second consecutive month.
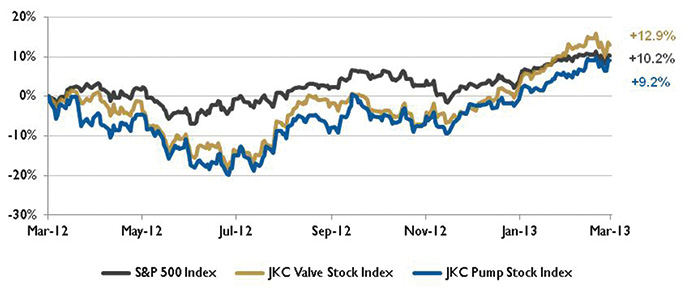
Figure 1. Stock Indices from March 1, 2012 to February 28, 2013
Source: Capital IQ and JKC research. Local currency converted to USD using historical spot rates. The JKC Pump and Valve Stock Indices include a select list of publicly-traded companies involved in the pump and valve industries weighted by market capitalization.
The Commerce Department reported that the U.S. gross domestic product (GDP) advanced at a 0.1 percent annual rate in the fourth quarter, 2012, an upward revision from its initial estimate of a 0.1 percent decline. The revision means that the economy has grown for 14 consecutive quarters. However, this was a sharp slowdown from the 3.1 percent GDP growth in the third quarter, as government spending fell 14.8 percent, including the largest percentage decrease in military spending since 1972. International trade added almost a quarter percentage point of growth because exports were stronger than estimated and imports lower. Despite fiscal uncertainty in Washington, the housing market rose 17.5 percent and business spending grew 9.7 percent. Consumer spending also increased at a 2.1 percent rate, a larger gain than in the third quarter.
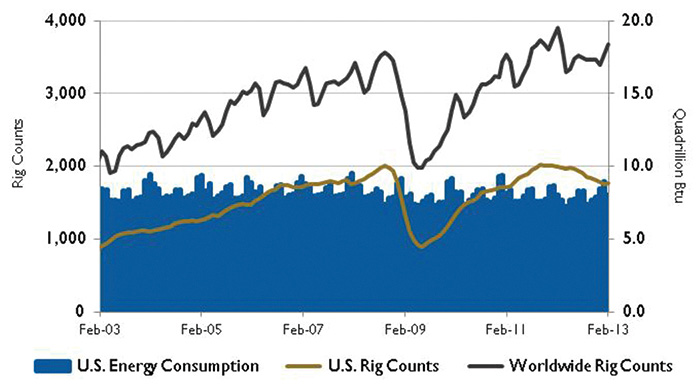
Figure 2. U.S. Energy Consumption and Rig Counts
Source: U.S. Energy Information Administration and Baker Hughes Inc.
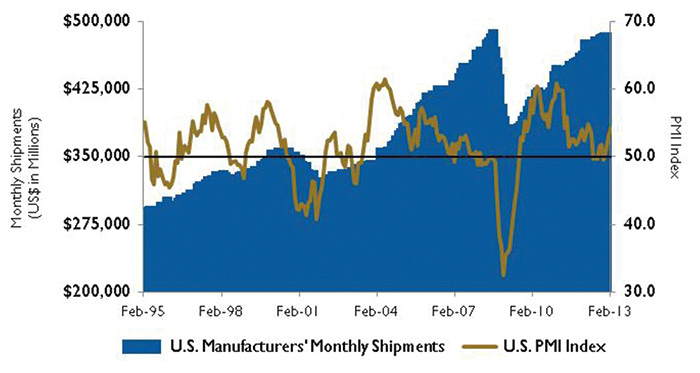
Figure 3. U.S. PMI Index and Manufacturing Shipments
Source: Institute for Supply Management Manufacturing Report on Business® and
U.S. Census Bureau.
Last year, world liquid fuels consumption reached 89.2 million barrels per day (bpd), growing by 0.9 million bpd over 2011. Due to a moderate recovery and global economic growth, the U.S. Energy Information Administration (EIA) estimates that growth in world liquid fuels consumption will pick up in 2013 to 90.2 million bpd and accelerate in 2014 to 91.6 million bpd. Asian countries not part of the Organization for Economic Cooperation and Development are expected to lead the global consumption growth. Specifically, the EIA estimates that liquid fuels consumption in China, which increased by 380,000 bpd in 2012, will increase by 450,000 bpd in 2013 and 470,000 bpd in 2014.
On Wall Street, The Dow Jones Industrial Average gained 1.4 percent. The NASDAQ Composite added 0.6 percent, and the S&P 500 Index finished February with four successive months of gains rising 1.1 percent. Federal Reserve Chairman, Ben Bernanke, boosted investor sentiment by providing assurances that the Federal Reserve would not make any major changes in its $85-billion bond buying program and that the program would continue “as long as needed.” Some critics believe that continuing this program could result in inflation and financial instability. P&S
Reference
1 The S&P Return figures are provided by Capital IQ.