


Based on several of my previous Pumps & Systems articles, you probably know that I have major concerns about the off best efficiency point (BEP) operation of wastewater pumps. Last month, I revisited suction recirculation and its potential effects on wastewater pumps due to the rather large eye diameter to impeller diameter ratio.
In 2010, this column discussed unbalanced radial thrust and how the wide vane impellers used in wastewater pumps are extremely vulnerable to the damage it can cause. In February 2011, I wrote an article on my Field Test Calculator. Although it accommodates several different pump designs, wastewater pumps were a major focus.
Draw Down
Flow meters are becoming more popular in many wastewater applications, but justifying their cost in smaller lift stations and those that are not connected to a SCADA network is often difficult. In the Northwest, the vast majority of these stations use draw down as the standard pump test technique. This testing method can be reliable as long as the data collected is accurate and the test is repeated several times to ensure reliability.
Often, a draw down test is used to measure pump flow rate, and then flow rate is used to determine where the pump is running on the H/Q curve. However, flow rate alone may not provide all the needed information. Pressure must also be measured to assess the true performance of the station.
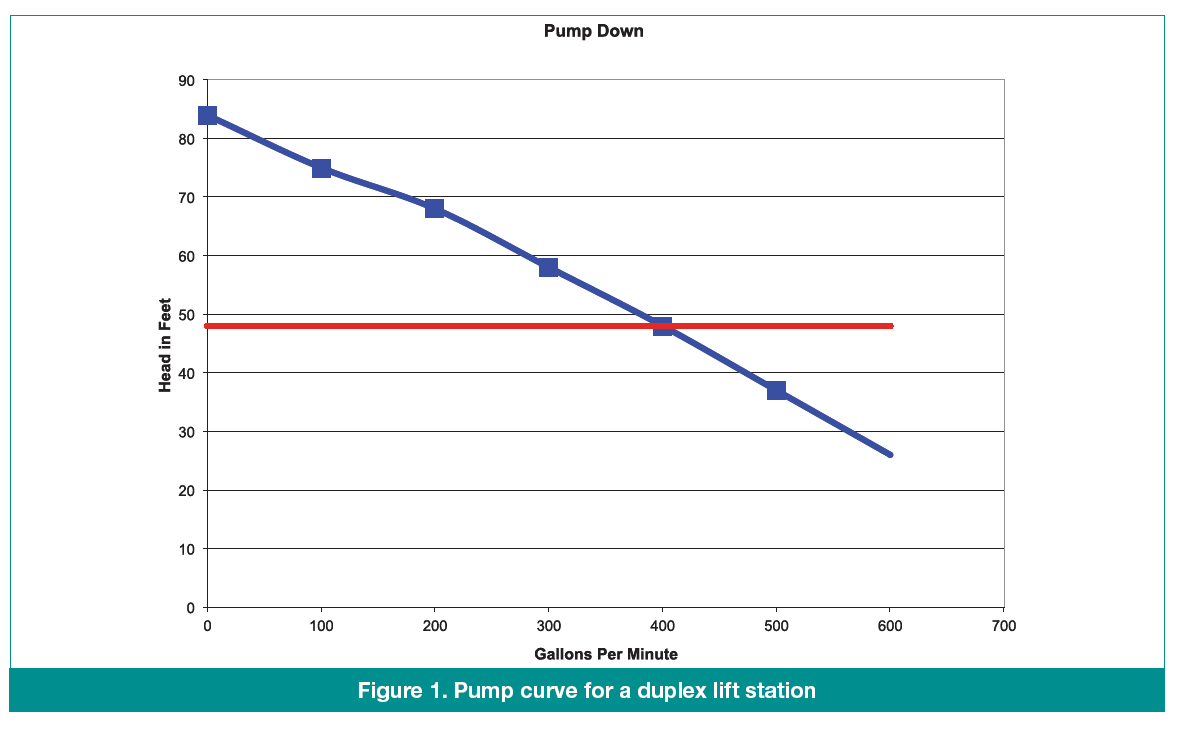
Figure 1. Pump curve for a duplex lift station
Figure 1 shows the pump curve for a duplex lift station that was designed to pump 400 gallons per minute (gpm) into a gravity main against a static head of 48 feet. The red, horizontal line is the system head at the pump-start level in the wet well. In this example, any friction in the discharge piping will be ignored.
In a standard draw down test, the wet well volume per foot is calculated and the time required to lower the water level one foot is recorded. Dividing the volume by the time in minutes provides us the flow rate in gallons per minute. When possible, we like to use one foot because little change in flow occurs for most pumps over such a small elevation change.
Suppose we perform several draw down tests and compute an average flow of 350 gpm. Based on the performance curve, the pump is operating at 55 feet instead of the design point of 48 feet. Is this reduced flow and increased head due to a blockage in the discharge pipe, or was the original design point incorrect?
It turns out that neither was the culprit. When the pressure was measured at the valve box and corrected for the elevation difference between the water level and the gauge, the operating head was nearly 48 feet. The actual cause of the reduced flow measurement was a leaking check valve that allowed part of the flow to return to the wet well through the other pump. This example is a case that I witnessed in the field and illustrates the importance of measuring both flow and pressure.
The Draw Down Calculator
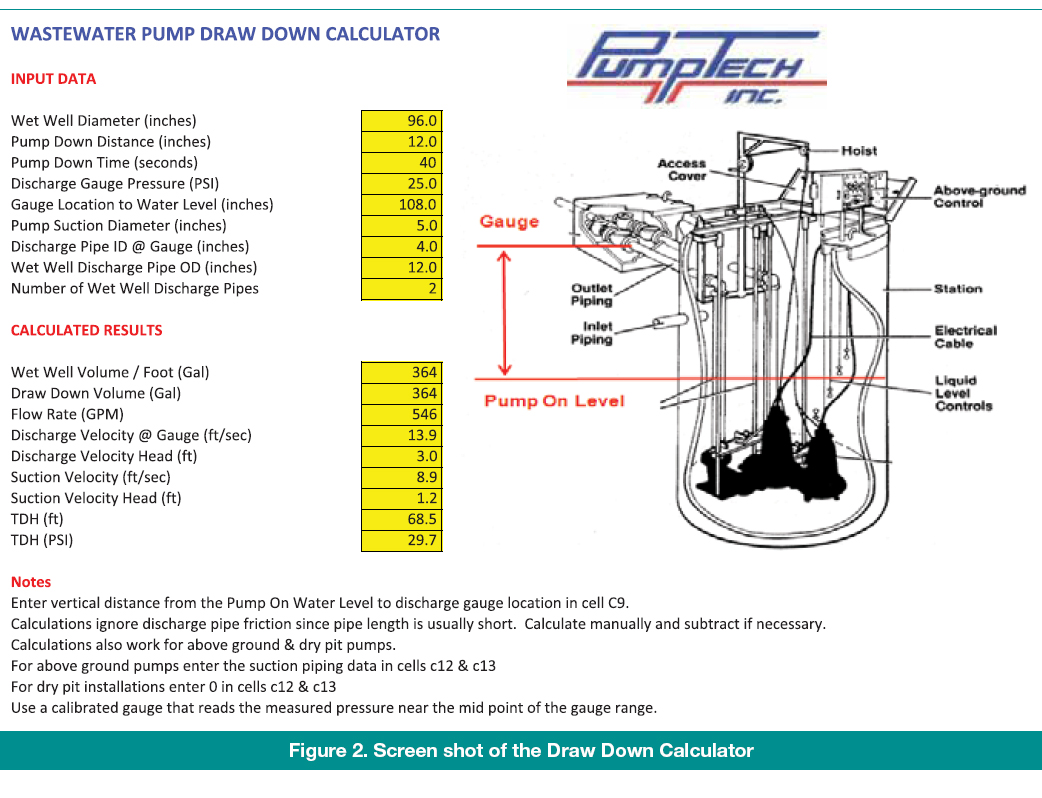
Figure 2. Screen shot of the Draw Down Calculator
Figure 2 is a screen shot of my Draw Down Calculator, which is available as an Excel spread sheet on the “Pump Sizing, Selection & Testing Tools” page at www.PumpEd101.com. It provides a standard procedure for testing wastewater pumps when a flow meter is not available. The calculations take into account the elevation difference between the pump start water level and the gauge position.
The calculator also includes the suction and discharge velocity heads in the total dynamic head (TDH) calculation. If the wet well contains submersible or above ground pumps, the wet well volume per foot can be corrected for empty discharge or suction piping in the wet well.
This can increase draw down accuracy in smaller wet wells. Testing wastewater pumps at least twice per year will reveal changes in operating conditions due to changes in system conditions and pump wear. It will also alert end users of potentially damaging off BEP operation.
Pumps & Systems, December 2011