


The Jordan, Knauff & Company (JKC) Valve Stock Index was up 30.2 percent during the last 12 months, above the broader S&P 500 Index which was up 17.6 percent. The JKC Pump Stock Index was up 29 percent for the same time period.1 In June, the Institute for Supply Management’s Purchasing Managers’ Index (PMI) registered 50.9 percent, an increase of 1.9 percentage points from May. This reading indicates expansion in the manufacturing sector for the fifth time during the first six months of 2013. The Prices Index registered 52.5 percent showing an increase of 3 percentage points from May, reflecting overall raw material price increases from last month. The New Orders Index rose 3.1 percentage points in June, and the Production Index rose 4.8 percentage points following last month’s contraction in both indices.
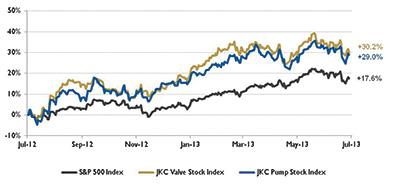 Stock indices from July 1, 2012 to June 30, 2013. Source: Capital IQ and JKC research. Local currency converted to USD using historical spot rates. The JKC Pump and Valve Stock Indices include a select list of publicly-traded companies involved in the pump and valve industries weighted by market capitalization.
 The Bureau of Labor Statistics reported that nonfarm payrolls increased by 195,000 in June and revised the April and May data by an additional 70,000 workers. Employment rose in leisure and hospitality, professional and business services, retail trade, health care, and financial activities. Manufacturing employment declined in June and has fallen for four straight months. During the past 12 months, manufacturing has added just 29,000 new workers, only 1.3 percent of the total 2.3 million nonfarm jobs added overall.
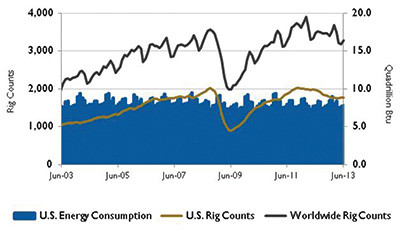 U.S. Energy consumption and rig counts. Source: U.S. Energy Information Administration and Baker Hughes Inc.
 The U.S. Energy Information Administration is projecting that U.S. primary energy consumption will grow by 0.3 percent per year from 2011 to 2040 to 107.6 quadrillion Btu. The largest growth (5.1 quadrillion Btu) is expected to be in the industrial sector. Encompassing manufacturing, mining, agriculture and construction, the industrial sector accounted for nearly a third of total U.S. energy use in 2012. Energy-intensive manufacturing accounted for a little more than 50 percent of the total industrial energy use last year. With its heavy reliance on coal and petroleum coke, the cement sector is the most energy-intensive of all manufacturing industries.
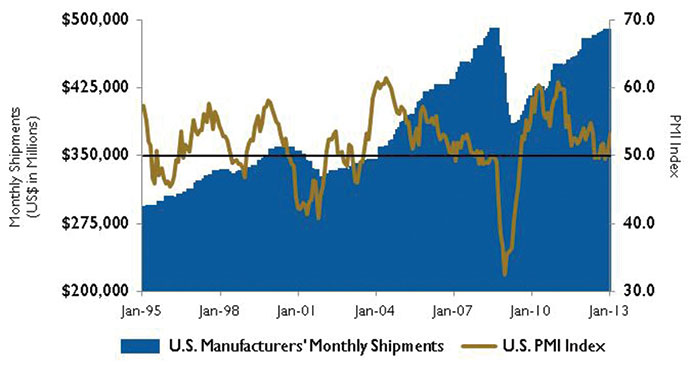 U.S. PMI index and manufacturing shipments. Source: Institute for Supply Management Manufacturing Report on Business® and U.S. Census Bureau.
On Wall Street, volatility dominated June following statements by the Federal Reserve that it could start to scale back on its bond purchasing program by the end of the year if the economy continues to improve. The Dow Jones Industrial Average declined 1.4 percent, while the S&P 500 Index and NASDAQ Composite both fell 1.5 percent for the month. Despite losses in June, all major indices were up between 12 percent and 14 percent for the first half of 2013. The Dow Jones Industrial Average gained 13.8 percent—its best first-half showing for any year since the bull market of 1999. The S&P 500 Index was up 12.6 percent for the first two quarters—its best performance since 1998. Gold prices were down 13 percent in June and fell 23 percent in the second quarter, the largest quarterly decline since 1974. Reference 1 The S&P Return figures are provided by Capital IQ.