


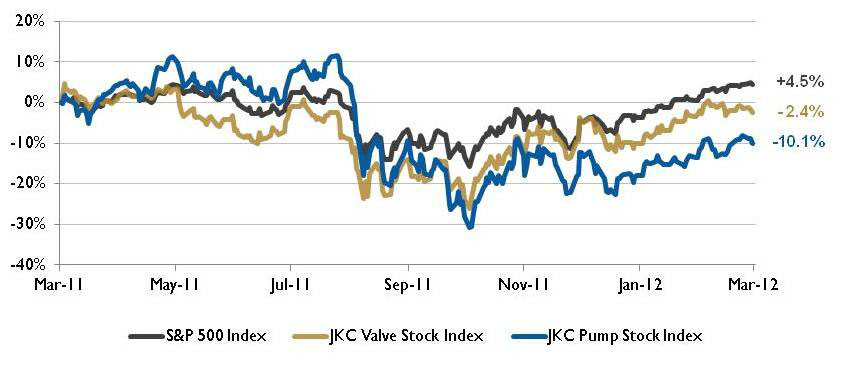
Figure 1. Stock Indices from March 1, 2011 to February 29, 2012
Source: Capital IQ and JKC research. Local currency converted to USD using historical spot rates. The JKC Pump and Valve Stock Indices include a select list of publicly-traded companies involved in the pump and valve industries weighted by market capitalization.
The Jordan, Knauff & Company (JKC) Valve Stock Index was down 2.4 percent over the last 12 months, below the broader S&P 500 Index which was up 4.5 percent. The JKC Pump Stock Index was down 10.1 percent for the same time period.
The Institute for Supply Management’s Purchasing Managers Index (PMI) slipped a bit in February, to 52.4 from 54.1 in January, showing the first decline since October. New orders, production and employment all grew, although at somewhat slower rates than in January. Raw materials prices increased for the second consecutive month, with the Prices Index registering 61.5 percent.
Another good sign was that February U.S. light-vehicle sales were stronger than expected for the second month. February’s seasonally adjusted annual rate was 15.0 million units, the highest since February 2008—a considerable increase from January’s 14.1 million units and February 2011’s 13.2 million units. The most recent Federal Reserve Board’s Beige Book reported that “overall economic activity continued to increase at a modest to moderate pace in January and early February,” noting the increase in manufacturing activity and higher levels of new orders, shipments and production.
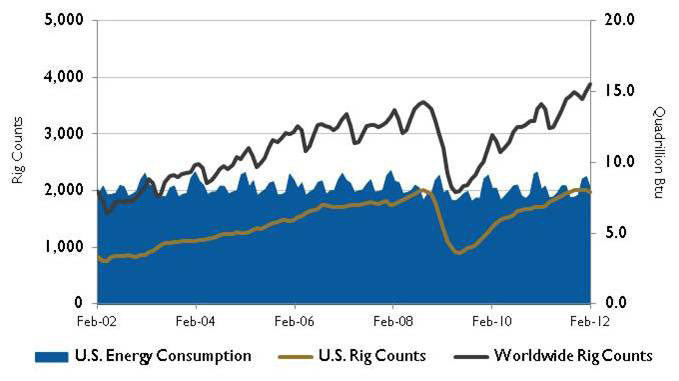
Figure 2. U.S. Energy Consumption and Rig Counts
Source: U.S. Energy Information Administration and Baker Hughes Inc.
Middle East and African supply disruptions contributed to an increase in crude oil prices in February. The U.S. Energy Information Administration increased its 2012 forecast for the average cost of crude oil to U.S. refiners from $105 per barrel to $115 per barrel. Baker Hughes reported that worldwide rig counts are at their highest since early 1985. The number (3,886) is almost 10 percent higher than February 2011.
The U.S. imported 8.9 million barrels per day of crude oil in 2011, the lowest since 1999. Crude oil imports as a share of consumption dropped to 44.8 percent, the lowest since 1995 and down from a 2005 peak of 60.3 percent. The U.S. is the world’s largest oil importer, but its demand has been curbed by high prices that inhibit driving and the use of more efficient cars and alternative fuels. Members of the OPEC cartel (including Saudi Arabia, Venezuela and Nigeria) supplied 47 percent of U.S. imports, while Canada was the largest single source of oil imports, accounting for 25 percent of the total.
On Wall Street the Dow Jones Industrial Average was up 2.5 percent in February and 6 percent for the year. The S&P 500 Index added 4.1 percent in February and 8.6 percent for the year. The Nasdaq Composite, which briefly went above the 3,000 mark, moved up 5.4 percent for the month and 14 percent for the year. Investors continue to keep a close eye on oil and rising gas prices.
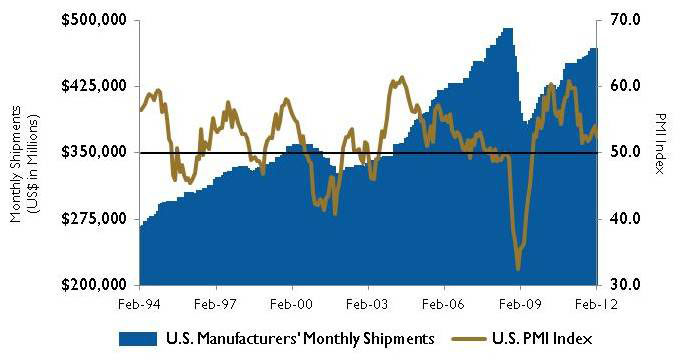
Figure 3. U.S. PMI Index and Manufacturing Shipments
Source: Institute for Supply Management Manufacturing Report on Business® and U.S. Census Bureau.
Pumps & Systems, April 2012
These materials were prepared for informational purposes from sources that are believed to be reliable but which could change without notice. Jordan, Knauff & Company and Pumps & Systems shall not in any way be liable for claims relating to these materials and makes no warranties, express or implied, or representations as to their accuracy or completeness or for errors or omissions contained herein. This information is not intended to be construed as tax, legal or investment advice. These materials do not constitute an offer to buy or sell any financial security or participate in any investment offering or deployment of capital.