


The Jordan, Knauff & Company (JKC) Valve Stock Index was down 4.2 percent over the last 12 months, below the broader S&P 500 Index which was down 0.3 percent. The JKC Pump Stock Index was down 27.6 percent for the same time period.
 |
|
Figure 1. Stock Indices from May 1, 2011 to April 30, 2012 |
Source: Capital IQ and JKC research. Local currency converted to USD using historical spot rates. The JKC Pump and Valve Stock Indices include a select list of publicly-traded companies involved in the pump and valve industries weighted by market capitalization.
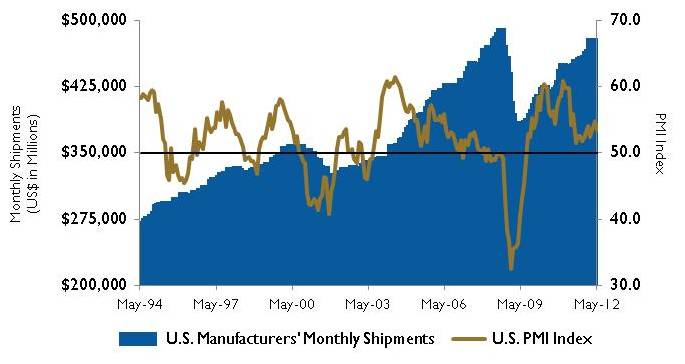
The Institute for Supply Management’s Purchasing Managers Index (PMI) registered 53.5 percent in May, a modest decrease from April, indicating that manufacturing sector growth continues but at a slightly more modest pace. The New Orders Index continued its growth trend registering 60.1 percent, increasing 1.9 percentage points over April. The Prices Index fell to 47.5 percent, dropping 13.5 percentage points. New orders increased for 13 out of 18 sectors including fabricated metals, electrical equipment, computers, machinery and chemicals. In addition, 13 sectors reported growth in employment.
 |
|
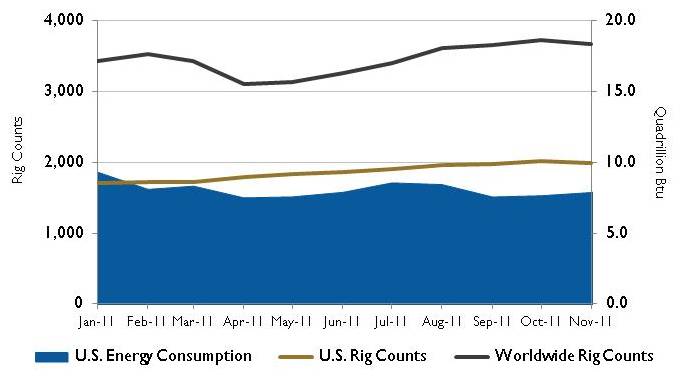
Figure 2. U.S. Energy Consumption and Rig Counts |
Source: U.S. Energy Information Administration and Baker Hughes Inc.
The U.S. economy grew slower during the first quarter than previously reported. The Bureau of Economic Analysis revised the real gross domestic product (GDP) growth in the first quarter from 2.2 percent to 1.9 percent.
The Bureau of Labor Statistics reported that the economy added 69,000 net new jobs in May, the smallest increase in a year. The private sector added an average of 105,000 jobs during the past three months. However, the gains remain disappointing compared to prior economic recoveries. The unemployment rate edged slightly higher to 8.2 percent.
Global oil markets have loosened in recent months, as world oil production outpaced consumption by 0.7 million barrels per day (BPD) in the first quarter of 2012. The U.S. Energy Information Administration expects world oil production to exceed consumption by 1.2 million BPD in the second quarter of 2012. West Texas Intermediate (WTI) crude oil spot prices averaged more than $100 per barrel during the first four months of 2012. The WTI spot price fell from $106 per barrel on May 1 to $83 per barrel on June 1, reflecting market concerns about oil demand growth due to poor economic indicators in Europe, China and the U.S.
 |
|
Figure 3. U.S. PMI Index and Manufacturing Shipments |
Source: Institute for Supply Management Manufacturing Report on Business® and U.S. Census Bureau.
On Wall Street, the Dow Jones Industrial Average and the S&P 500 Index dropped more than 6 percent in May, while the NASDAQ Composite Index declined more than 7 percent. The weakness was fueled by fears of a slowing U.S. economy and escalating concerns about the Eurozone debt crisis, with Spain and Greece keeping contagion worries front and center. The Dow and NASDAQ logged their worst monthly performances since May 2010, and the S&P 500 posted its biggest monthly loss since September 2011.
These materials were prepared for informational purposes from sources that are believed to be reliable but which could change without notice. Jordan, Knauff & Company and Pumps & Systems shall not in any way be liable for claims relating to these materials and makes no warranties, express or implied, or representations as to their accuracy or completeness or for errors or omissions contained herein. This information is not intended to be construed as tax, legal or investment advice. These materials do not constitute an offer to buy or sell any financial security or participate in any investment offering or deployment of capital.