


The Jordan, Knauff & Company (JKC) Valve Stock Index was up 12.8 percent over the last 12 months, above the broader S&P 500 Index, which was up 10.6 percent. The JKC Pump Stock Index was up 15.7 percent for the same time period.1
In March, the Institute for Supply Management’s Purchasing Managers’ Index (PMI) registered 51.3 percent, a decrease of 2.9 percentage points from February’s reading, indicating a slower rate of expansion for the manufacturing sector.
Of the 18 industries surveyed, 14 reported growth. The Employment Index component increased 1.6 percent above February’s reading of 52.6 percent.
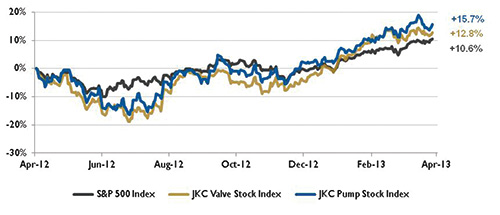
Figure 1. Stock indices from April 1, 2012, to March 28, 2013. Source: Capital IQ and JKC research. Local currency converted to USD using historical spot rates. The JKC Pump and Valve Stock Indices include a select list of publicly-traded companies involved in the pump and valve industries weighted by market capitalization.
The JPMorgan Global Manufacturing PMI showed expansion for the third straight month with an average reading of 51.2 percent for the first quarter 2013, above the 49.5 percent of the prior quarter. The U.S. led global manufacturing output growth in March and has experienced production rise throughout most of the past four years. Japan recorded growth for the first time in 10 months, while the rate of expansion accelerated in China. Europe remained the principal drag on the global manufacturing sector, with output declining in both the U.K. and the Eurozone.
Although global manufacturing employment improved for the fourth consecutive month in March, the rate of job creation was slight. The PMI survey also showed that global manufacturers struggled to pass along their higher costs with increased selling prices.
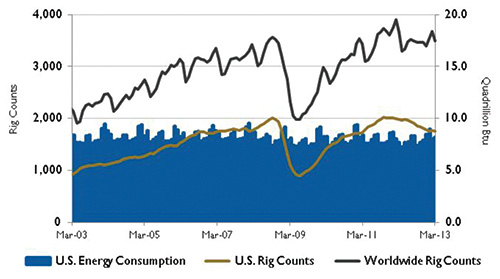
Figure 2. U.S. Energy Consumption and Rig Counts. Source: U.S. Energy Information Administration and Baker Hughes Inc.
For the first time since 1995, the U.S. Energy Information Administration (EIA) expects U.S. crude oil production to exceed imports by the end of this year. U.S. liquid fuel net imports, including crude oil, have been falling since 2005 when they reached 12.5 million barrels per day (bpd). Total net imports fell to 7.4 million bpd in 2012 and are expected to decline to an average of 6 million bpd by 2014.
Globally, Saudi Arabia cut crude oil production heavily in the last quarter of 2012, which contributed to an increase in prices at the beginning of 2013. Although the death of Venezuelan President Hugo Chavez could ultimately affect the oil sector, the EIA believes that the country’s current policies will be maintained. In Libya, the EIA lowered its oil production forecast based on the persistence of technical and political problems, which have already affected output.
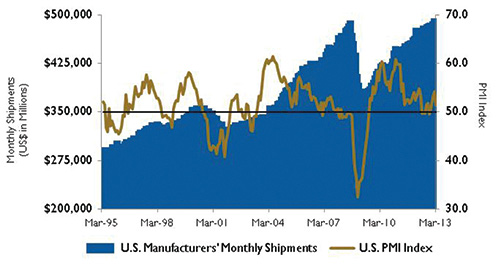
Figure 3. U.S. PMI Index and Manufacturing Shipments. Source: Institute for Supply Management Manufacturing Report on Business® and U.S. Census Bureau.
On Wall Street, The Dow Jones Industrial Average traded at record highs throughout March and had its best first quarter since 1998, gaining 11.3 percent. The S&P 500 Index rose 10 percent, and the NASDAQ Composite was up 8.2 percent during the first three months of 2013. The largest gains were made in January, but March was also a solid month, with all three benchmarks rising more than 3 percent.
Reference
1 The S&P Return figures are provided by Capital IQ.