


As any austenitic stainless steel would be, 316 stainless steel is very soft. So how does this stainless steel offer strong protection against cavitation? If it is soft, will the imploding bubbles erode the material?
Stainless steel provides excellent resistance to cavitation because of its work-hardening property. An indentation can be made on the surface of an unworked stainless steel strip. However, after hitting the strip with a hammer for some time, it becomes much more difficult to make indentations—the surface work-hardens. Ironically, stainless steel’s softness is the reason it is difficult to machine—it work-hardens as a cutting tool passes over it, resulting in a chunky, chisel-like chip, instead of a smooth, clean cut.
The same process occurs when cavitation bubbles bombard the surface of stainless steel. It work-hardens and begins to resist further cavitation. Because of this work-hardening characteristic, 316 stainless steel (CF8M) resists cavitation about 10 to 15 times better than cast iron. Further metallurgical modifications can make stainless steel even more resistant to cavitation. For example, cast-grade stainless steel (CA6NM) is roughly three times more resistant to cavitation when compared to 316 stainless steel.
One of the most popular materials among the austenitic stainless steels is 316 stainless steel. It contains between 16 and 18 percent chromium and between 10 and 14 percent nickel, which are its main alloying elements. It also has 2 to 3 percent molybdenum, and carbon is limited to less than 0.08 percent. If carbon is limited to 0.03 percent, the steel becomes 316L.
Austenitic stainless steels (sometimes referred to as 18-to-8 grades (18 percent chromium, 8 percent nickel) have excellent corrosion-resistance properties. They cannot be hardened, except with cold work, which makes them resistant to cavitation.
The other important groups of stainless steels are martensitic and ferritic. Series 400 is martensitic stainless steel, and it is magnetic. Series 300 is austenitic, and it is not magnetic. Whether stainless steel is magnetic or not magnetic depends on its composition (alloying elements) and the way (heat treat) that it is produced.
The main alloying element in 431 stainless steel is chromium—roughly 16 percent—which makes it resist corrosion well, certainly better than plain carbon steel. It also makes it hardenable, which is why martensitic alloys are good for pump shafts. Martensitic alloys are strong.
When initially cast at the foundry, stainless steel has an austenitic structure at high temperature and cools after it is poured. As it cools, austenite begins to transform to martensite, which happens around 770 C (1,418 F). Certain alloying elements—including chromium and nickel—can delay or prevent this transformation. Metallurgists use a Schaeffler diagram, which shows nickel-equivalent and chromium-equivalent contents that are required to keep the alloy in a martensitic or austenitic state (see Figure 1).
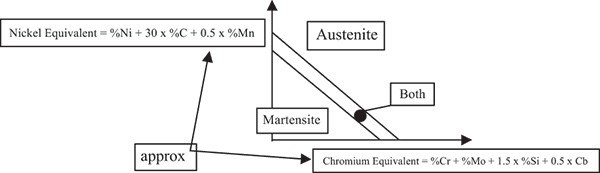 Figure 1. Schaeffler diagram
The addition of nickel keeps the 316 stainless steel alloy in an austenitic zone. A 431 stainless steel only contains chromium, so it transforms into a martensitic structure.
Equipment inspectors often use a quick test to make sure a part is 316 stainless steel. They use a magnet and attempt to attach it to a part. If the magnet sticks, they know something is wrong, since 316 stainless steel is austenitic and not magnetic. However, once in a while, the magnet feels as if it is pulled toward a 316 stainless steel part, although just slightly. This could indicate some minor amount of residual martensite in the structure.
Many expressions for chromium equivalent and nickel equivalent weldments exist. Schaeffler, Schoefer and Delong diagrams are a few examples. Delong’s diagrams include nitrogen effects into the nickel equivalent expressions.
For example, the Schaeffler diagram showing the amount of ferrite and austenite present in weldments gives:
Chromium equivalent =
%Cr + %Mo + 1.5 x %Si + 0.5 x %Nb (or Cb)
Note: Niobium (Nb) and Columbium (Cb) are the same element with a dual name.
Nickel Equivalent = %Ni + 30 x %Cr + 0.5 x %Mn
The Schoefer diagram for estimating the average ferrite content in austenitic iron-chromium-nickel stainless castings is given in American Society for Testing and Materials (ASTM) A800 along with the diagram for chromium equivalent (Creq)/nickel equivalent (Nieq) ratio. The ferrite content of castings is estimated from the composition ratio of the chromium equivalent to the nickel equivalent. The equations are slightly different based on Schoefer:
Chromium equivalent = %Cr + 1.4 x %Mo + 1.5 x %Si + %Nb (or Cb) – 4.99
Nickel equivalent = %Ni + 30 x %C + 0.5 x %Mn + 26 x (%N – 0.02%) + 2.77
Ferrite content in weldments and castings is determined primarily by the balance between ferrite and austenite stabilizers or elements that tend to form ferrite and austenite. By adjusting the ratio of ferrite stabilizers (chromium, molybdenum, silicon, and niobium or columbium) to austenite stabilizers (nickel, manganese, carbon and nitrogen) the ferrite content can be controlled and can be estimated using the Schoefer constituent diagram relating ferrite content in castings to chemical composition, which is an adaptation of the well-known Schaeffler diagram developed for predicting the microstructure of stainless weldments.
Although the Schaeffler, Schoefer and Delong diagrams all provide reasonable accuracy, castings should be evaluated using the Delong diagram, even though it was originally intended for weld metal deposits and includes the effects of nitrogen. The Delong diagram consistently provides the most accurate prediction of delta ferrite in cast austenitic stainless steels.
Because chemical composition influences microstructure, many empirical relationships and constitution diagrams have been developed throughout the years to predict microstructure. In all cases, the chromium equivalent and nickel equivalent have been used to predict the effect of different alloy additions on the ferrite forming and austenite forming relationship.
Considerable disagreement exists regarding these equivalency relationships and formulas. As Stephen Morrow noted, the Schaeffler diagram was developed in the 1940s to predict weld microstructures. This was refined by Delong and by the Welding Research Council (WRC) in 1988 and again in the WRC-1992 diagram.
The following is a summary of some of these relationships for chromium and nickel equivalency, but many other modified expressions exist:
- Schaeffler in 1949
- Chromium equivalent = Cr + Mo + 1.5 Si + 0.5 Nb
- Nickel equivalent = Ni + 0.5 Mn + 30 C
- Delong in 1956
- Chromium Equivalent = Cr + Mo + 1.5 Si + 0.5 Nb
- Nickel Equivalent = Ni + 0.5 Mn + 30 C + 30 N
- Hull in 1973
- Chromium equivalent = Cr + 1.21 Mo + 0.48 Si + 0.14 Nb + 2.27 V + 0.72 W + 2.20 Ti + 0.21 Ta + 2.48 Al
- Nickel equivalent = Ni + (0.11 Mn – 0.0086 Mn squared) + 24.5 C + 14.2 N + 0.41 Co + 0.44 Cu
- Hammar and Svennson in 1979
- Chromium equivalent = Cr + 1.37 Mo + 1.5 Si + 2 Nb + 3 Ti
- Nickel equivalent = Ni + 0.31 Mn + 22 C + 14.2 N + Cu
- Siewert in 1992
- Chromium equivalent = Cr + Mo + 0.7 Nb
- Nickel equivalent = Ni + 35 C +20 N + 0.25 Cu
The next time you are near a metal part, touch it with a magnet.