


A brinefield injection pump is a critical part of any brine or salt-plant operation practicing solution-mining for raw material.
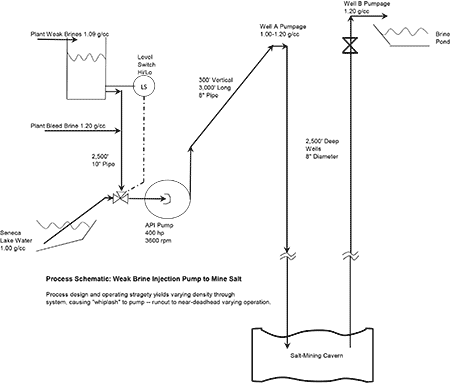
For the two years for which records were available, one of this pair of 400 horsepower (hp), 3,600 rotations per minute (rpm), 4x3x16-inch centrifugal pumps (Image 1, top) was failing every two months. The maintenance costs were predictable and high.
Each failure instance was a process disruption to the making of brine for a salt plant and entailed maintenance and contractor costs, but why it was such a troublesome pump was a mystery, and the high costs could not be tolerated.
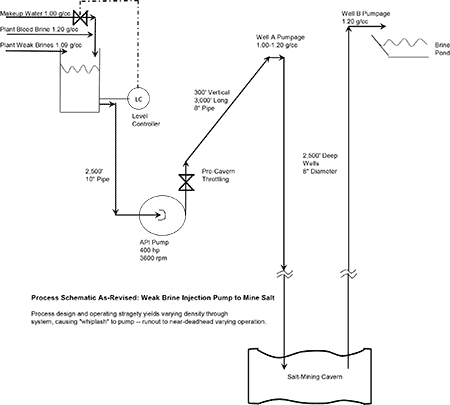
The process design at the time was as shown in Image 2. So far as anyone knew, this design dated back to 1984 when this pump and process design to recycle bleeds was adopted.
Due to the process design and upstream pipeline configuration, pumpage could vary from 1 gram per cubic centimeter (g/cm3) when on water, to 1.20 g/cm3 (100% salinity) when a slug of fully-saturated brine came through. Average density over time was about 50% salinity or 1.10 g/cm3, but the pump did not see the average so much as the variances.
The downstream piping was another part of the story, as the brine wells were 2,500 feet deep. These made a U-tube design with varying-density pumpage on the left leg and saturated brine at 1.20 g/cm3 on the right.
As if the process design was not enough of a challenge to the pump, the operators had adopted, as preferred practice, post-cavern throttling. This was a recent development in the last couple of years and exacerbated what was already a problematic situation. Because of this, pumps were having to be switched out every two months.
So, the combination of process design and operational practice sent the pump through a cycle of near-deadhead operation to the left of best efficiency point (BEP), then crossing over the BEP to operating in cavitation to the far right of BEP.
The post-cavern throttling was preferred by the operators because of the logic that “brine would keep flowing for a long time after a pump had failed.” The operators did not realize that this practice was promoting the frequent failure syndrome.
Looking at the records of the system operation, the high and low flow records during a month told part of the story. There was a large variance from lowest to average to highest flow. Many of the daily readings put the flow at what would be too far from the BEP.
The problem was not just high or low flow but both (occurring at different times). The pump was swinging back and forth across its performance curve from as low as 100 gallons per minute (gpm) to a high rate of 860 gpm which was beyond the end of the performance curve and when cavitation-noise was strong.
The power consumed by the motor told a more surprising story. The motor was frequently in an overloaded condition, with amps as high as 60—far above nameplate rating at 52.
These pointed to excess flow of high-density fluid as a serious problem from the motor-loading aspect as well, and all that power was going into the pump and causing self-destruction every two months.
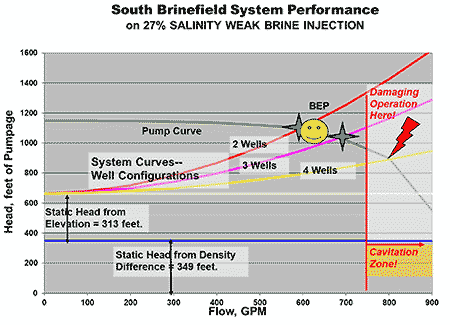
Why would so much variance be occurring? Some data on the density of the pumpage helps flesh out the story. Measured salinity varied from 8% to 86% in more than 200 readings, and the averages were about 50% (Image 4). Salinity variance, combined with the process design, was forcing the pump to vary all over its flow range.
Looking at the entire system, it could be run with either two wells operating (one in, one out), three wells (two in one out or vice-versa) or four wells (two in, two out), which treated the pumps to considerably different discharge-friction losses, depending on the configuration.
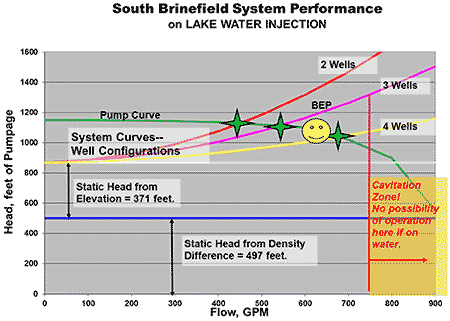
Hydraulic models were developed for the different situations. The pump was suited to the situation with pumping on water only, and flow would not go into the cavitation zone (Image 7).
When looking at the system performance with the low-range 27%-salinity weak brine (1.05 g/cm3), users find that with low outlet friction (four wells), the system can go into overrun and cavitation if not throttled.
Static head from elevation has been reduced because of the three-way valve switch away from lake water. Static head from the density difference had been reduced from 497 feet to only 349 feet, due to the higher-density fluid. The system performance curves shift to the right and drop against the pump’s performance curve (Image 5).
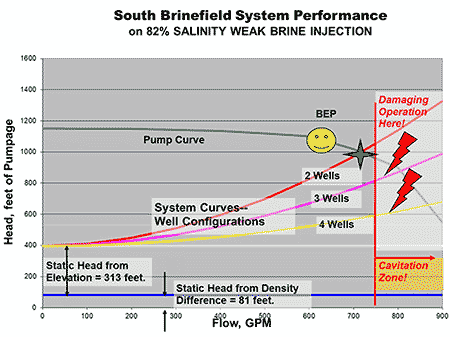
Similarly, with pumpage density higher at 82% salinity weak brine (1.16 g/cm3), the static head from density difference is decreased further, moving the system curves farther out on the pump curve.
With such high-density fluid, the static head from density difference drops to only 81 feet, and all three discharge situations lead to cavitating flow far to the right of BEP (Image 8).
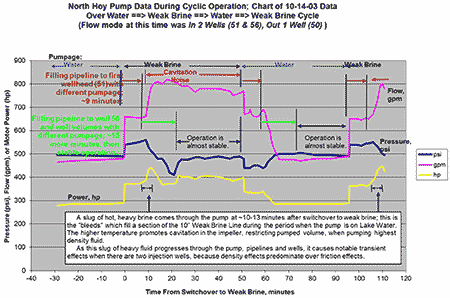
The above is all theoretical, but look at what the actual pump was doing. Observation showed the pump was going through a repetitive cycle that ran the pump across its pump curve, clear to cavitation at greater than 750 gpm when on hot fluid then back to far left of the BEP (Image 6).
At switchover from lake water to weak brine pumpage by the three-way valve, the flow, pressure and power all went up because the density had increased, along with inlet pressure, from -5 to +50 pounds per square inch (psi). This is set as time = 0. Then, starting at about 13 minutes, a slug of high-density brine came through, and flow and power increased further.
Pressure decreased, however, because of a downstream effect, with higher density brine filling the well depth. Cavitation noise began as the high-density and hot brine passed through the pump, and cavitation continued until the three-way valve switched back to lake water at about 52 minutes into the cycle. Transients again occurred as water first filled the pipeline and then the well. Flow decreased and became steady as the system was fully filled with water. Then, at 98 minutes, the three-way valve switched, and the cycle repeated.
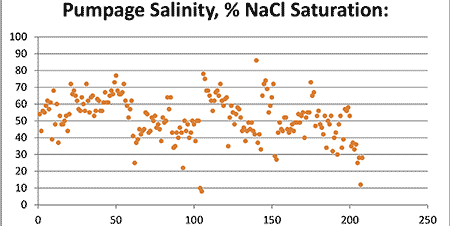
How can users cure the frequent failure problem? Remove the causes of variance and make the pump run steady by:
- Stopping post-cavern throttling.
- Putting in a discharge throttling valve and switching to pre-cavern throttling.
- Stopping use of the three-way valve at the pump inlet for makeup water.
- Putting in makeup water upstream to blend with all other forms of brine to average the pumpage density.
- Modifying the pump to a variable frequency drive (VFD) instead of constant speed and a more sophisticated controlling system can blend the makeup water in continuously.
Those changes are shown in Image 3, the modified process design as revised.
The longevity one would expect of this pump was then achieved, and seal life became the limiting factor rather than bearing failure. Life was further extended when the impeller was trimmed for power conservation, first from 16.0 to 14.5 inches diameter, then to 14.0 inches and finally to 13.75 inches. It was run for many years in that mode. The pump had become a reliable part of the salt-making process, instead of an every-two-month nightmare.
The former drive was 4,160 volts (V) and not readily speed-controlled. When plant demands called for more capacity, the impeller was returned to 16.0 inches with a variable frequency drive (VFD), driving a new 480 V drive in a new location. Dropping the operating speed to match process needs and eliminating any valve-throttling was another benefit to pump longevity.