


The Jordan Knauff & Company (JKC) Valve Stock Index was up 2.6% over the last 12 months, and the broader S&P 500 index was down 7.8%. The JKC pump stock index rose 2.5% for the same time period.1
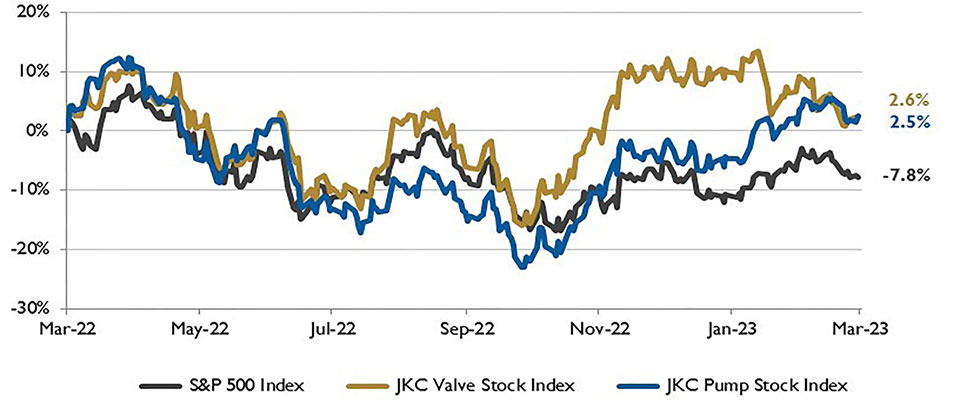
Local currency converted to USD using historical spot rates. The JKC Pump and Valve Stock Indices include a select list of publicly traded companies involved in the pump and valve industries, weighted by market capitalization. Source: Capital IQ and JKC research.
The Institute for Supply Management’s Purchasing Managers Index (PMI) increased to 47.7% from 47.4% but marked the fourth consecutive month in contraction territory. The New Orders Index rose to 47%, but 12 of the 18 industries surveyed reported a decline in new orders.
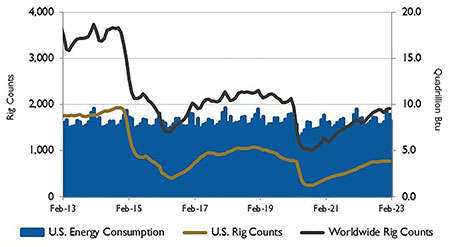
Source: U.S. Energy Information Administration and Baker
Hughes Inc.
The Prices Index was up at 51.3%, compared to the January figure of 44.5%. The Employment Index dropped into contraction at 49.1%, down from January’s 50.6%. Surveyed companies indicate they will not greatly reduce employee count, as they are more positive about the second half of 2023.
Industries that reported growth were apparel, leather and allied products; transportation equipment; petroleum and coal products; and electrical equipment, appliances and components. Due to a record drop in utilities output of 10%, U.S industrial production was flat in January after having declined in six of the prior eight months. Mining output rose 2% and manufacturing production was up 1%.
Food and beverage manufacturing and chemicals rose 1.7% and 1.6%, respectively. Machinery, electrical equipment and appliances and computers also advanced. The largest declines came from wood products and plastics, both down 1%. The reopening of China’s economy is providing some lift to global growth.
The benchmark Henry Hub natural gas price declined by 41%, or $2.26 per million British
thermal units (MMBtu) in January compared with December.
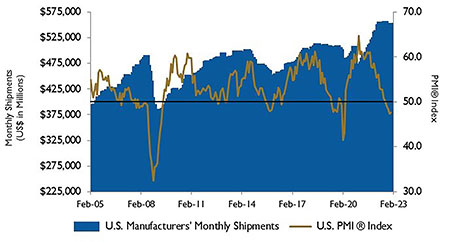
Source: Institute for Supply Management Manufacturing Report
on Business and U.S. Census Bureau
The price decline was driven by reduced natural gas consumption due to warmer than average temperatures across the U.S. and by increased natural gas production.
January was the warmest since 2006. Strong production combined with less consumption reduced natural gas withdrawals from storage by 55%. The Henry Hub price is forecast to average $3.40/MMBtu in 2023, down almost 50% from last year.
The U.S. Energy Information Administration expects oil production in Russia to average 9.9 million barrels per day (b/d) this year, down 1.1 million b/d from 2022.
The European Union’s ban on seaborne petroleum products from Russia will cause refineries to reduce crude oil inputs, which will disrupt crude oil production.
On Wall Street for the month of February, the Dow Jones Industrial Average fell 4.2%, the S&P 500 Index lost 2.6% and the Nasdaq Composite was down 1.1%.
Markets were volatile due to fears that continued interest rate hikes by the Federal Reserve Bank would push the economy into recession. Economic data shows that inflation is still a concern.
REFERENCES
1 - The S&P Return figures are provided by Capital IQ.