


Pumps & Systems, February 2013
The Jordan, Knauff & Company (JKC) Valve Stock Index was up 8.2 percent during 2012, below the broader S&P 500 Index which was up 13.4 percent. The JKC Pump Stock Index was up 3.2 percent for the same time period.1
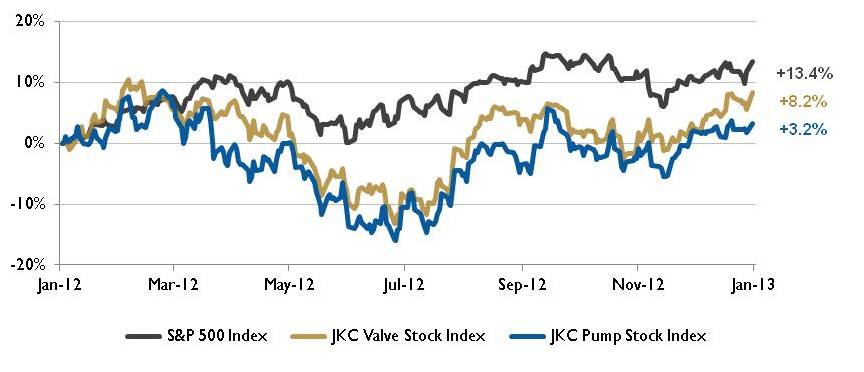
Figure 1. Stock Indices from January 1, 2012 to December 31, 2012
Source: Capital IQ and JKC research. Local currency converted to USD using historical spot rates. The JKC Pump and Valve Stock Indices include a select list of publicly-traded companies involved in the pump and valve industries weighted by market capitalization.
The Institute for Supply Management’s Purchasing Managers’ Index (PMI) moved slightly higher in December to 50.7 percent from a contracting 49.5 percent in November. During the last seven months of 2012, the PMI was below 50 four times, and overall manufacturing activity was slower than earlier in 2012.
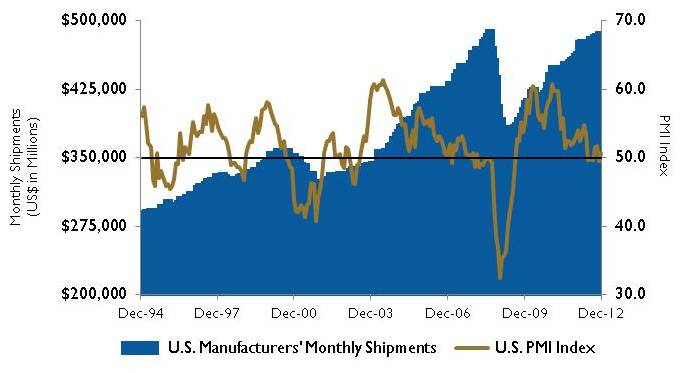
Figure 3. U.S. PMI Index and Manufacturing Shipments
Source: Institute for Supply Management Manufacturing Report on Business® and U.S. Census Bureau.
The Labor Department reported that U.S. nonfarm payroll employment grew by 155,000 jobs in December, bringing the total number of jobs created in 2012 to 1.84 million. December’s figure was slightly better than the average growth of 153,000 jobs per month, which was similar to the 2011 pace. The manufacturing sector added 25,000 new workers in December and 180,000 workers in 2012.
The U.S. Energy Information Administration (EIA) believes that oil markets will loosen in 2013 and 2014 as increasing global supply offsets higher global consumption. The EIA is projecting world supply will increase by 1.0 million barrels per day in 2013 and 1.7 million barrels per day in 2014. Most growth is expected to come from outside OPEC, with North America accounting for most of it. Due to the continued production growth from U.S. tight oil formations and Canadian oil sands, North America is expected to contribute approximately two-thirds of the projected growth in non-OPEC liquid fuels during the next two years. To accommodate the projected increase in global consumption and to counterbalance supply disruptions, the EIA projects that OPEC members will continue to produce at least 30 million barrels per day of crude oil during the next two years.
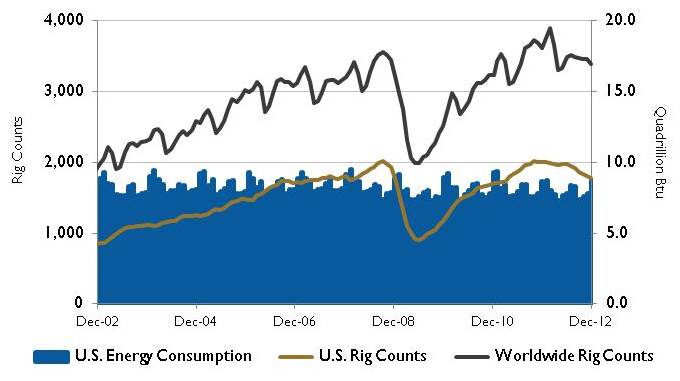
Figure 2. U.S. Energy Consumption and Rig Counts
Source: U.S. Energy Information Administration and Baker Hughes Inc.
After averaging $94 in 2012, the EIA predicts that the price of West Texas Intermediate crude oil will average $90 per barrel in 2013 before increasing to an average of $91 per barrel in 2014. According to Baker Hughes Inc., average monthly rig counts have risen during the past four years. In the U.S., monthly rig counts averaged 1,919 in 2012, a 76 percent increase over average monthly rig counts in 2009. Worldwide average monthly rig counts increased 52 percent.
Wall Street ended 2012 on a high note. The Dow Jones Industrial Average gained 7.3 percent, the S&P 500 Index rose 13.4 percent, while the NASDAQ Composite added 15.9 percent in 2012. The Federal Reserve’s announcement of QE3 in September also helped the markets move higher. The financial sector gained 26.3 percent in 2012 and was the biggest gainer among the S&P 500 industry groups. P&S
Reference
1 The S&P Return figures are provided by Capital IQ.
These materials were prepared for informational purposes from sources that are believed to be reliable but which could change without notice. Jordan, Knauff & Company and Pumps & Systems shall not in any way be liable for claims relating to these materials and makes no warranties, express or implied, or representations as to their accuracy or completeness or for errors or omissions contained herein. This information is not intended to be construed as tax, legal or investment advice. These materials do not constitute an offer to buy or sell any financial security or participate in any investment offering or deployment of capital.