


In recent years, there has been a surge in the promotion of products, software and services related to condition monitoring, heralding a new era in maintenance practices. While the visibility of these products has increased, the promised return they propose will be achieved is often vague. This article will highlight a real-world application of wireless condition monitoring, specifically in the domain of vibration analysis of heavy machinery.
Vibration analysis is an integral part of condition monitoring and represents a discipline within the broader field of predictive maintenance. While it is not the only parameter that needs to be considered when evaluating system health, vibration is a useful indicator of existing and developing problems. This is because vibration acts as a symptom of forces at work within a system, sometimes amplified by natural frequencies within the system.
An effective condition monitoring program should provide a direct link to diagnosis and action. At the very least, it should provoke further investigation and provide analytical tools to support determining the root causes of identified issues. An example of a successful condition monitoring strategy can be seen through the experience of a major steel producer that was experiencing costly maintenance issues on critical pumps in the steelmaking process. By upgrading data collection from a route-based system to a wireless condition monitoring system, the company was able to detect a problem in its incipient stages and resolve the issue before a catastrophic failure occurred.
System Adoption
The steel mill had a horizontal multistage pump in the descaling service whose mean time between repair (MTBR) was
less than what other plants were achieving on similar equipment. To better understand the modes of failure, how they developed and how they could be prevented, the mill opted to adopt a wireless monitoring solution.
The end user had previously been using route-based data collection with a handheld vibration analyzer; the route had a collection frequency of once per month. By upgrading to a wireless condition monitoring solution, data was collected 24/7 with a full-time waveform signature being taken every 30 minutes and an overall amplitude reading being taken every five minutes.
This new collection frequency would allow the mill to observe any alarm events in near real-time—reducing the time to action. It also allowed the end user to collect data in a broader spectrum of the machinery’s operating conditions. The
data collected allowed plant personnel to isolate specific maintenance needs of the machine based on condition—not based on hours of operation.
The end user partnered with an aftermarket pump service company to provide the wireless condition monitoring service, which included hardware, software and a service that combines monitoring oversight, event support and subject matter expertise. Wireless triaxial accelerometers were installed on the bearing housing of the pump, gearbox and motor for five machine trains to capture temperature and vibration data. The monitored data was sent wirelessly from the sensors to a collection gateway in the general vicinity of the machinery. This gateway transmitted the data via cellular signal to the web-based software platform for analysis. Plant personnel were able to monitor vibration and thermal performance from this software platform, and the aftermarket service company’s engineers monitored the data in parallel from Chicago.
Problem Identification
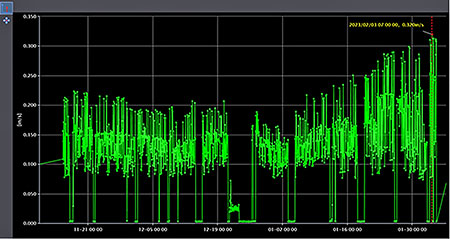
After monitoring the five machine trains for more than a year, there was a noticeable increase in overall vibration amplitude on one of the machines in the pump inboard bearing housing location. The radial vibration amplitude increased from approximately 0.1 inches per second (ips) root mean square (RMS) to nearly more than 0.3 ips RMS over the course of four weeks. As in this case, many failure modes result in vibration levels increasing rapidly—often much faster
than the typical time between route-based data collection.
It should be noted while the amplitude of 0.3 ips RMS may not be a concerning level for all machines, some machines naturally operate with a high base level of vibration. The overall vibration level is usually less significant than a change in the amplitude over time. In condition monitoring performed over an extended period, it is imperative to focus on significant step changes in amplitudes. As shown in Image 1, going from a steady state of approximately 0.1 ips RMS to three times that amount over a period of a few weeks was cause for concern and investigation.
As the amplitudes increased, automated email alerts were sent to the end user and the aftermarket service provider’s monitoring team, notifying them of the step changes in vibration amplitude. Analysis of the vibration signatures—specifically using spectral data and relative phase angle data—allowed a probability matrix of potential root causes to be developed. Maintenance actions and inspections were derived directly from the probability matrix, leading to a swift intervention and solution to the issue.
Problem Diagnosis
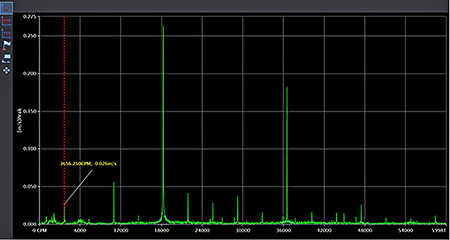
In this specific instance, the baseline spectrum of the pump inboard bearing included a discrete frequency peak at 1X run speed and at the vane pass (VP) frequency of the pump due to low flow operation. As the vibration increased, the
1X and VP frequencies remained but increased in amplitude. A notable difference in the spectrum as the overall amplitude increased was the presence of additional harmonic frequencies, e.g.,
2X, 3X, 4X, 2 x VP.
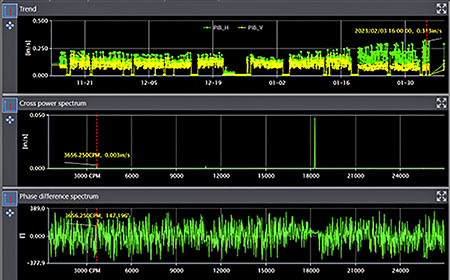
The excitation of multiple harmonics of run speed is well correlated with mechanical looseness in a bearing housing. In addition to the harmonics, mechanical looseness exhibits as an elevation in the noise floor due to the inconsistency and transience of the forces present. The inconsistency is demonstrated best by looking at the relative phase angle measurement between channels, which are erratic from one measurement to the next.
The wireless sensors installed on the descale pumps sample simultaneously, allowing for relative phase angle measurements between all sensors, channels, axes, etc. A cross-channel phase tool showed the phase relationship was inconsistent as amplitudes increased. This further validated the looseness assessment as the highest probability source of increased vibration.
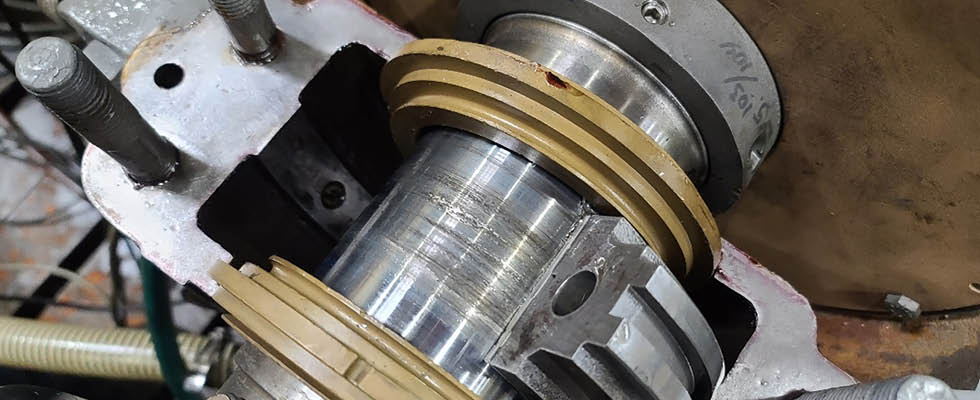
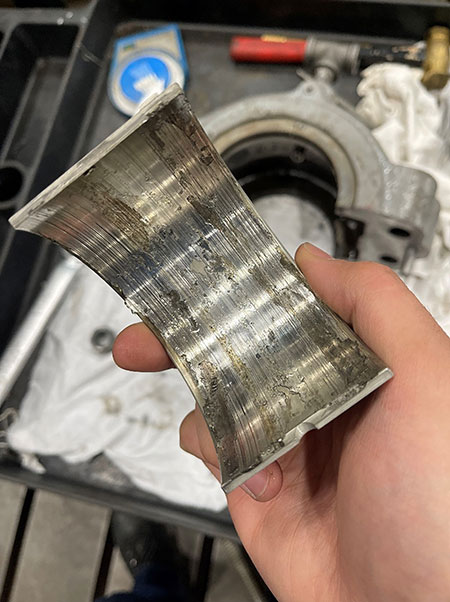
Because the vibration amplitude was not above shutdown thresholds, the recommendation was to perform a bearing inspection at the next scheduled shutdown. The pump inboard bearing cap was to be removed and the bearing insert rolled out for inspection. If bearing clearances had increased or contact was made with the soft babbitt material of the journal and the pump shaft, there would be physical signs of damage. As expected, when the journal bearing was inspected, it showed signs of wear. The babbitt material had wiped and collected in one area of the bearing. While not catastrophic, it is important to underscore continued operation would have resulted in increasingly worse physical damage and ultimately failure.
As evidenced in the experience of the steel mill, the benefit of having a well-developed wireless condition monitoring service over a traditional route-based vibration service is clear. As online monitoring technology has continued to evolve and mature, the cost of investment in this kind of system has decreased and is far outweighed by the level of protection it offers.
A key consideration when upgrading to an internet of things (IoT)-based condition monitoring program is the hardware, software and service provided are designed to distinguish between different modes of failure. This requires capturing data in a broad enough frequency range, measuring phase data and using pattern recognition to suggest possible root causes for observed trends.
Having a monitoring partner that can provide subject matter expertise to further refine the information provided through the system, assess the risk of continued operation and recommend actions for field validation is also critical in helping end users develop an effective and efficient predictive maintenance strategy.