


Key Takeaways on General M&A Activity in 2023
- Deal activity measured as deal count has held up well worldwide despite economic and geopolitical headwinds.
- Total deal value has been impacted by deal mix—smaller deals that typically trade at lower multiples versus larger deals.
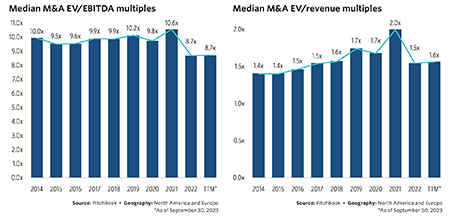
- Valuation multiples in the private lower middle market in 2023 have remained consistent with prior strong levels in 2022 and 2021.
General M&A Activity & Valuations
Global M&A activity by quarter
For all of the discussion that M&A activity has slowed, it does not show in the deal count numbers. As shown in the quarterly deal count (blue line plus the yellow dots showing where Pitchbook estimates the final deal counts will be once all the data is in and compiled), the deal activity level over the trailing 12 months (TTM) through Q3 2023 is down 5.2% versus the prior TTM primarily because that comparison includes the record Q4 2021. Deal activity worldwide has been quite stable despite the headwinds of rising interest rates and geopolitical uncertainty. What has been impacted is the total value of deals (blue bars in Image 1), which is a function not only of the number of transactions but the size of the transactions and the valuation multiples, which in turn are impacted by the mix of size and types of industries (e.g., health care versus industrials).
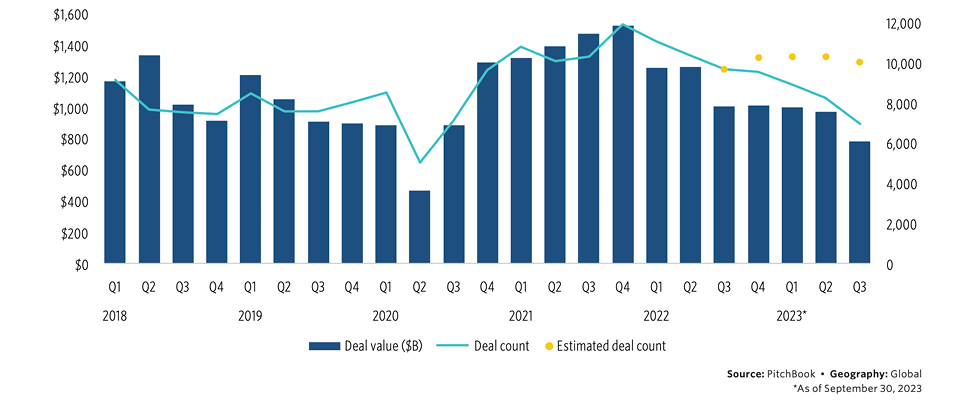
Source: Pitchbook Q3 2023 Global M&A Report
One conclusion that can be drawn from the total deal value being down significantly while deal count is relatively flat is that we are possibly seeing deal size down due to more bolt-on middle market and lower middle market activity rather than mega transformational activity.
North American M&A activity by quarter
Activity in North America, based on deal count, has declined substantially—13.5% TTM Q3 2023 versus TTM Q3 2022 (blue line plus the yellow dots in Image 2).
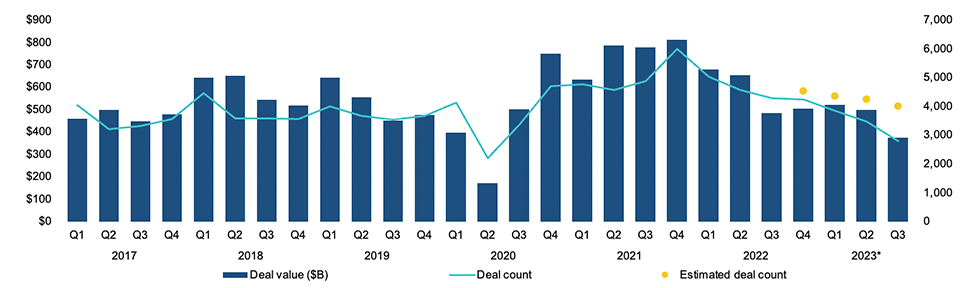
Source: Pitchbook Q3 2023 Global M&A Report
As shown above, the trend has been consistently down since the peak in Q4 2021. One can speculate, based on anecdotal and some empirical data, that the decline is due to reduced activity by financial sponsors (private equity and family offices) resulting from higher interest rates and more restricted availability of leverage capital.
European M&A activity by quarter
Activity in Europe, based on deal count, has increased 3.1% TTM Q3 2023 versus TTM Q3 2022 (blue line plus the yellow dots in Image 3).
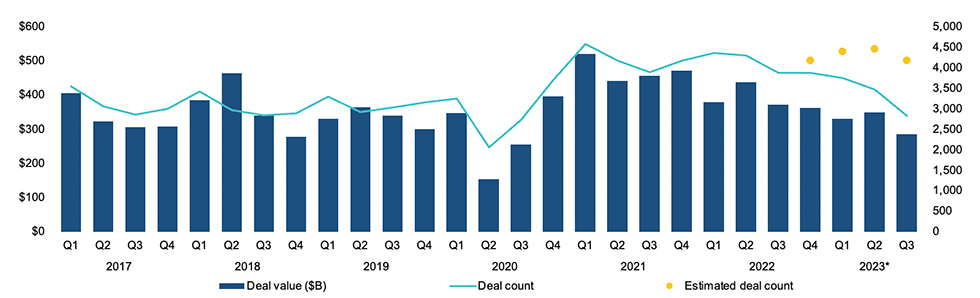
Source: Pitchbook Q3 2023 Global M&A Report
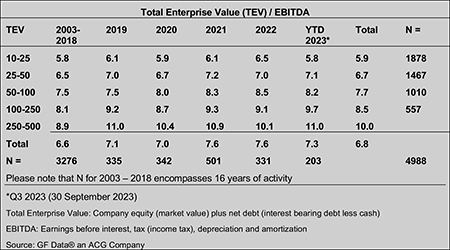
The headwinds from energy uncertainty and the war in Ukraine have apparently not deterred M&A activity in Europe. With the decline in deal activity in North America and the increase in Europe, the worldwide deal activity level is about equal on a TTM basis. The above data from Pitchbook indicates a marked step down in valuations in 2023. It would appear the market is impacted by public company valuations that have experienced multiple compression, possibly lower growth expectations, as well as more uncertainty in the economic outlook and geopolitical situation. Size and industry sector mix could also be factors. The data from GF Data, which is based on deal information provided by contributing private equity firms, indicates the private lower middle market valuations have remained strong.
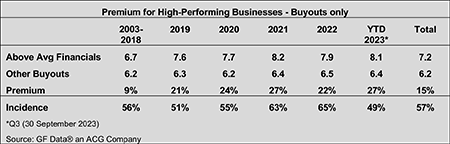
It is also important to note there is a premium for companies with at least 10% per year sales growth and at least a 10% earnings before interest, taxes, depreciation and amortization (EBITDA) margin. This premium has been consistently present over recent years in the low to upper 20% range and paid in about 50% of the buyout transactions.
Fluid Handling Industry M&A Activity & Valuations 2023
Key takeaways on the fluid handling industry M&A activity
Deal activity in the fluid handling industry remained strong in 2023, overcoming a dip in activity in Q3. It seems buyers remain committed to seeking strategic add-ons despite increased interest rates and the prospect of slowing growth in 2024.
Valuation multiples have remained strong (based on limited data points). There is sufficient competition among strategic buyers and enough private equity activity to support strong valuation levels.
There was a shift in activity toward North American targets, perhaps reflecting relatively strong market conditions versus Europe, as well as buyers seeking smaller deals and targets that are mostly focused on the aftermarket, where service and helping customers operate more efficiently can drive growth.
Fluid Handling Industry M&A Activity Last 5 Years
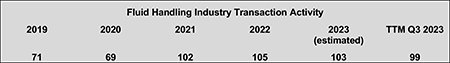
Source: Global Equity Consulting, LLC research
The level of deal activity in 2023 remains strong despite the increased macro headwinds from increased interest rates and compression of public company multiples as well as increased economic and geopolitical uncertainty (Image 7). Many companies in the industry have had strong years in 2023—even record years for growth and profitably. As a result, they have the cash and debt capacity to continue to pursue acquisitions that are a strategic fit.
Water Is the Most Targeted End-Use Market
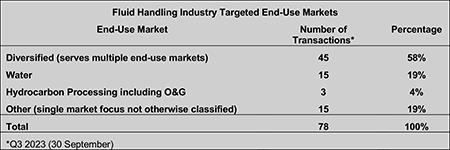
Source: Global Equity Consulting, LLC research
Over the last few years, other than companies that serve multiple industrial sectors, companies that serve some sector of the broad water market have been the most targeted companies by acquirers, as more companies move to realign their markets served with what they expect to be above average growth opportunities.
North America Is the Most Targeted Region
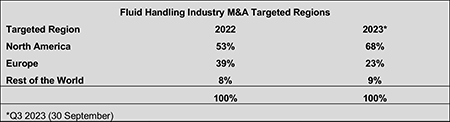
Source: Global Equity Consulting, LLC research
Image 9 shows a significant shift toward North America in the fluid handling industry deals in 2023. This has been a trend over the last couple years, most likely related to the higher uncertainty in Europe. One additional factor could be the type of targeted businesses has shifted toward distribution and service businesses that are more aftermarket focused and away from manufacturing businesses. In the past, more than half of the targets (61% in 2022) were manufacturing business, and in 2023 that has declined to 46%. That shift could also play a role in causing more acquisition activity in North America, where distribution and service companies are a larger component of the industrial supply chain compared to Europe.
Fluid Handling Industry M&A Activity Concentrated With Most Active
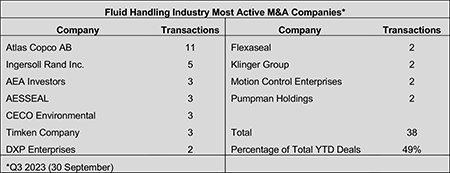
Source: Global Equity Consulting, LLC research
As shown in Image 10, the 11 companies that made multiple acquisitions through YTD Q3 2023 (September 30, 2023) accounted for 49% of the M&A activity in the industry. Four are either private equity or private equity owned (AEA, AESSEAL, Motion Control and Pumpman).
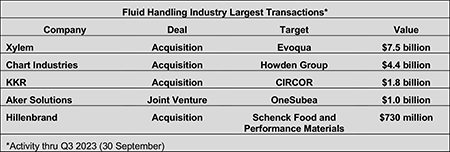
Fluid Handling Industry Largest Transactions
Source: Global Equity Consulting, LLC Research
The Xylem acquisition of Evoqua was an all-stock transaction valued at approximately $7.5 billion. The combined company becomes the world’s largest pure-play water technology company, with $7.3 billion in pro forma revenue and more than 22,000 employees globally.
Through the acquisition of Howden, Chart Industries has gained immediate access to new customers and commercial opportunities, increasing their geographic footprint to over 35 countries. KKR has a successful history in the fluid handling/flow control space and employee ownership, having merged Gardner Denver with the Ingersoll Rand industrial business. With the acquisition of CIRCOR, they are taking the public company private at $56.00 per share. KKR will also support CIRCOR in implementing a broad-based employee ownership program to allow all its employees to have the opportunity to participate in the benefits of ownership of the company.
Aker Solutions, SLB and Subsea7 have formed a subsea joint venture. The new business, which will adopt the OneSubsea name, will help users unlock reserves and reduce cycle time. OneSubsea now comprises Aker Solutions’ and SLB’s subsea businesses, which include a complementary subsea production and processing technology portfolio and strengthened research and development (R&D) capabilities.
The acquisition of the Schenck Process Food and Performance Materials (FPM) business from Schenck Process Group advances Hillenbrand’s long-term growth strategy by increasing scale in the food end market, particularly within the pet food sector. Additionally, this adds complementary technologies and processing expertise while also expanding the offerings and capabilities within Hillenbrand’s Advanced Process Solutions segment across existing key end markets, including food, durable plastics and chemicals.
Fluid Handling Industry Valuations Remain Strong
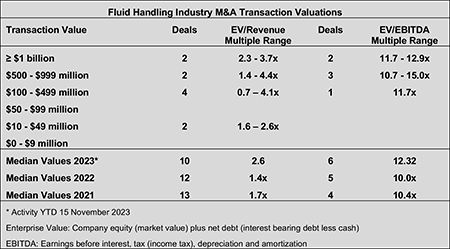
Source: Global Equity Consulting, LLC Research
Thoughts About 2024 Fluid Handling Industry M&A
- A soft landing is more likely than not.
- Interest rates are likely to stabilize.
- Real GDP growth, at least in the U.S., is likely to slow.
- Companies in our industry are finishing 2023 with growing backlogs and positive price/cost ratios.
- Companies in our industry remain interested in pursuing strategic acquisitions.
- Both strategic corporate buyers and private equity buyers have high levels of cash.
- Private business owners are not getting any younger and are open to ownership transition discussions.
- There could be a growing valuation expectation gap between buyers and sellers driven by buyers’ more conservative growth projections looking forward.
A modest slowing in M&A activity is possible in 2024, along with some deal making challenges to bridge valuation gaps. However, strategic imperatives, strong cash positions and the expectation for a relatively soft landing will likely support an active and competitive M&A environment in the fluid handling industry in 2024.